new web: http://bdml.stanford.edu/pmwiki
TWiki > Rise Web>ClimbingRobot > LegDesign > StanfordTestTrack > StanfordTestTrackSummer04Tests>StanfordFrictionTests (16 Jul 2004, AMcClung? )
Stanford Friction Tests on Test Track
The 1st round of friction tests were perfomed on the acrylic leg prototype, using several foot design materials and wall materials. The foot designs were either mounted directly on the ankle prototype or on the lamella foot structure. The leg was preloaded against the wall by a given position command, then the leg was slowly moved thru the trajectory for a short period to determine the maximum friction before skip. The following table summarizes the initial test results. Note that accelerometer data was not included in this testing, thus the determination of some friction coefficients is subject to the data selection point.Friction Coefficients (approx)
| _ | Lam #1 (35A) toes down |
Lam #1 (35A) toes up |
Lam #2 (90A) toes down |
Lam #2 (90A) toes up |
Scotch Tape | Carpet Tape |
|---|---|---|---|---|---|---|
| Glass | 2.0 | 1.0 | 1.0 | 1.2 | 5.5 | X |
| Ceramic Smooth | 1.2 | X | 0.8 | X | 1.3 | X |
| Ceramic Rough | 0.6 | X | 0.9 | X | 2.0 | X |
| Cork | 1.2 | 1.0 | 0.8 | 0.9 | 2.9 | 2.5 |
| Handi-Back | 0.13 | X | 0.27 | X | 1.0 | X |
- The lamella toes were used as representative of designs using 35A (leg #1) and 90A (leg #2) urethanes.
- The lamella toes have directional structures, so they were tested with these structures in the default (down) position and also an inverted position (facing up).
- The carpet tape slipped off the ankle structure very quickly, so only one test was performed. (ie. a new attachment method is needed)
- The scotch tape was replaced between tests for wall materials that leave residue (Handi-Back, cork, rough ceramic)
- The expected slip trends were not as apparant as anticipated (clearly visible in scotch tape on glass). Future testing should include accelerometer data, which may help identify the instance of slip. Also, slower movement and a larger wing force (position command) may be used to enhance the tests.
Sample friction test data
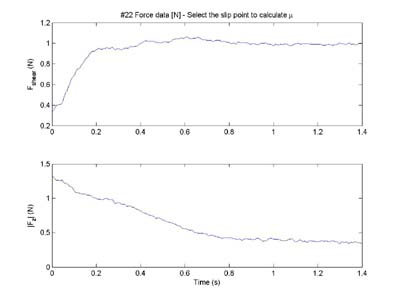
This is a test of scotch tape on glass. The in-plane forces of the climbing wall were combined to give the shear force. The shear force builds up to the friction limit (around 0.8sec), then the tape bounces along the glass surface. In this test it is easy to identify the limit where slip starts.
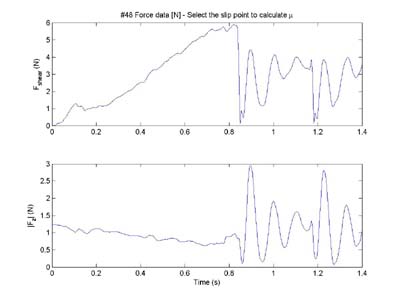
This is a test with lamella #1 (soft - 35A) on glass. Compared to the scotch tape on glass, it is quite a bit more difficult to determine the actual friction limit. By selecting various points in the data, the values of the friction coefficient can change by an order of magnitude or more. With the addition of accelerometer data, we may be able to more clearly identify the slip limit.
2nd Round Friction Coefficients (approx)
The 2nd round of friction testing included 2 axis accelerometer data to help identify the instance of slip, and better determine the friction limit. Also, thin strips of unshaped urethane were tested to help determine the effect of the lamella structures.| _ | Lam #1 (35A) toes up |
Lam #1 (35A) toes down |
Lam #2 (90A) toes up |
Lam #2 (90A) toes down |
Lam #3 (35A) strip |
Lam #4 (10A) strip |
|---|---|---|---|---|---|---|
| Glass | 1.5 | 0.9 | 1.2 | 0.9 | 2.2 | ~15 |
| Ceramic Smooth | 1.5 | 0.9 | 0.6 | 0.6 | 1.1 | ~10 |
| Ceramic Rough | 0.6 | 1.0 | 0.9 | 1.0 | 1.0 | ~4 |
| Cork | 1.1 | 1.1 | 0.8 | 0.7 | 1.0 | >10 |
| Handi-Back | 0.15 | 0.15 | 0.3 | 0.35 | 0.7 | 0.3 |
- Lam #3 is a thin continuous strip of 35A (soft) mounted on the back of a toe
- Lam #4 is a strip of 10A (very soft)
- May need more testing to thouroughly identify values for Lam #4
- The materials were not cleaned between tests
- The cork and Handi-Back tests were done last to avoid residue (& use) effects
- The smooth side of the tile may not have been cleaned (this may account for some of the bad performance seen there)
Ideas, requests, problems regarding TWiki? Send feedback