new web: http://bdml.stanford.edu/pmwiki
TWiki > Rise Web>ClimbingRobot > ForceSensingAnkle>ForceAnkleForcePlateCalibration (07 Sep 2005, SalomonTrujillo)
Calibrating Force Sensing Ankle with the Force Plate
By using the Force plate, a sticky-foot and the ForceSensingAnkle in parallel, a calibration matrix can be determined that transforms strain gauge signals to forces through the load cell. Assume that the ball-joint in the foot will prevent moments from being read at the load cell, we can assume that forces through the force plate are the same as the forces through the ball-joint.Setup
The ForceSensingAnkle and sticky-foot are mounted at the end of a 4-ft 5/16" diameter wooden dowel, to maintain the orientation of the ankle. The flexiblity of the dowel ought to allow small translations while preventing any rotations. A piece of printer paper is adhered to the force plate to provide a clean surface for the sticky foot to contact with.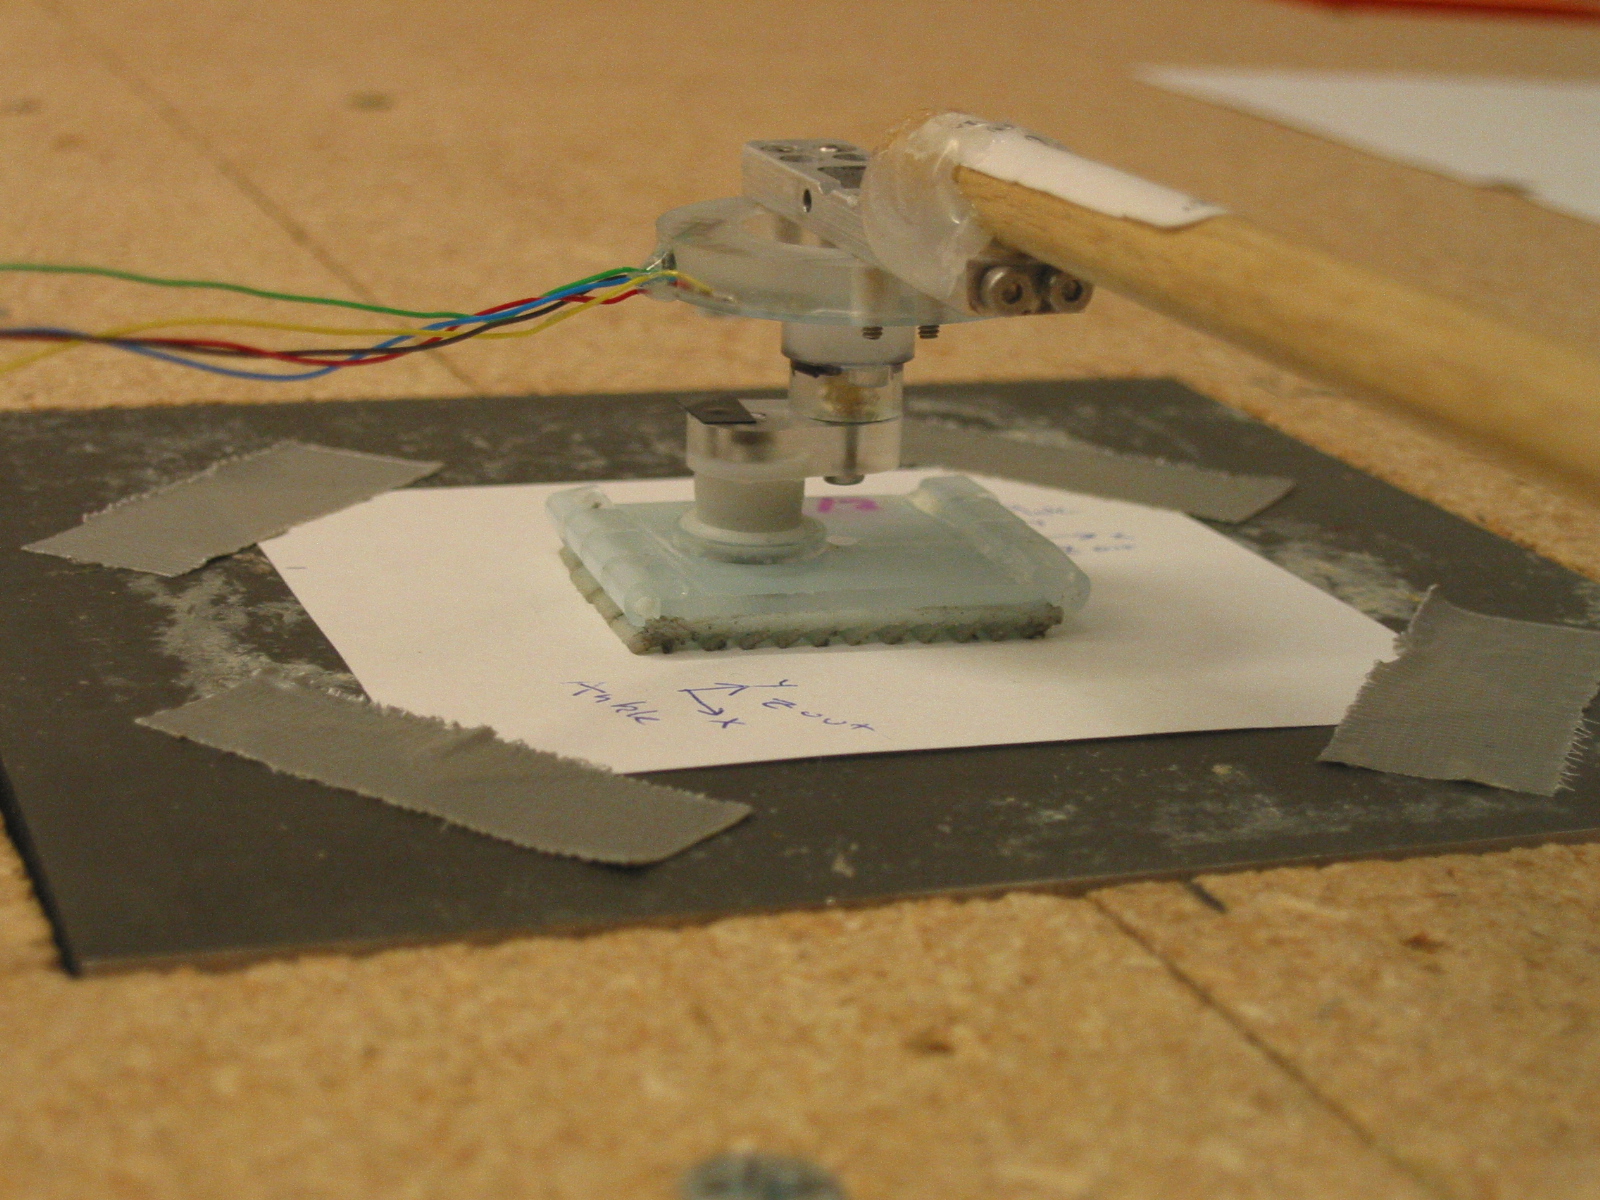
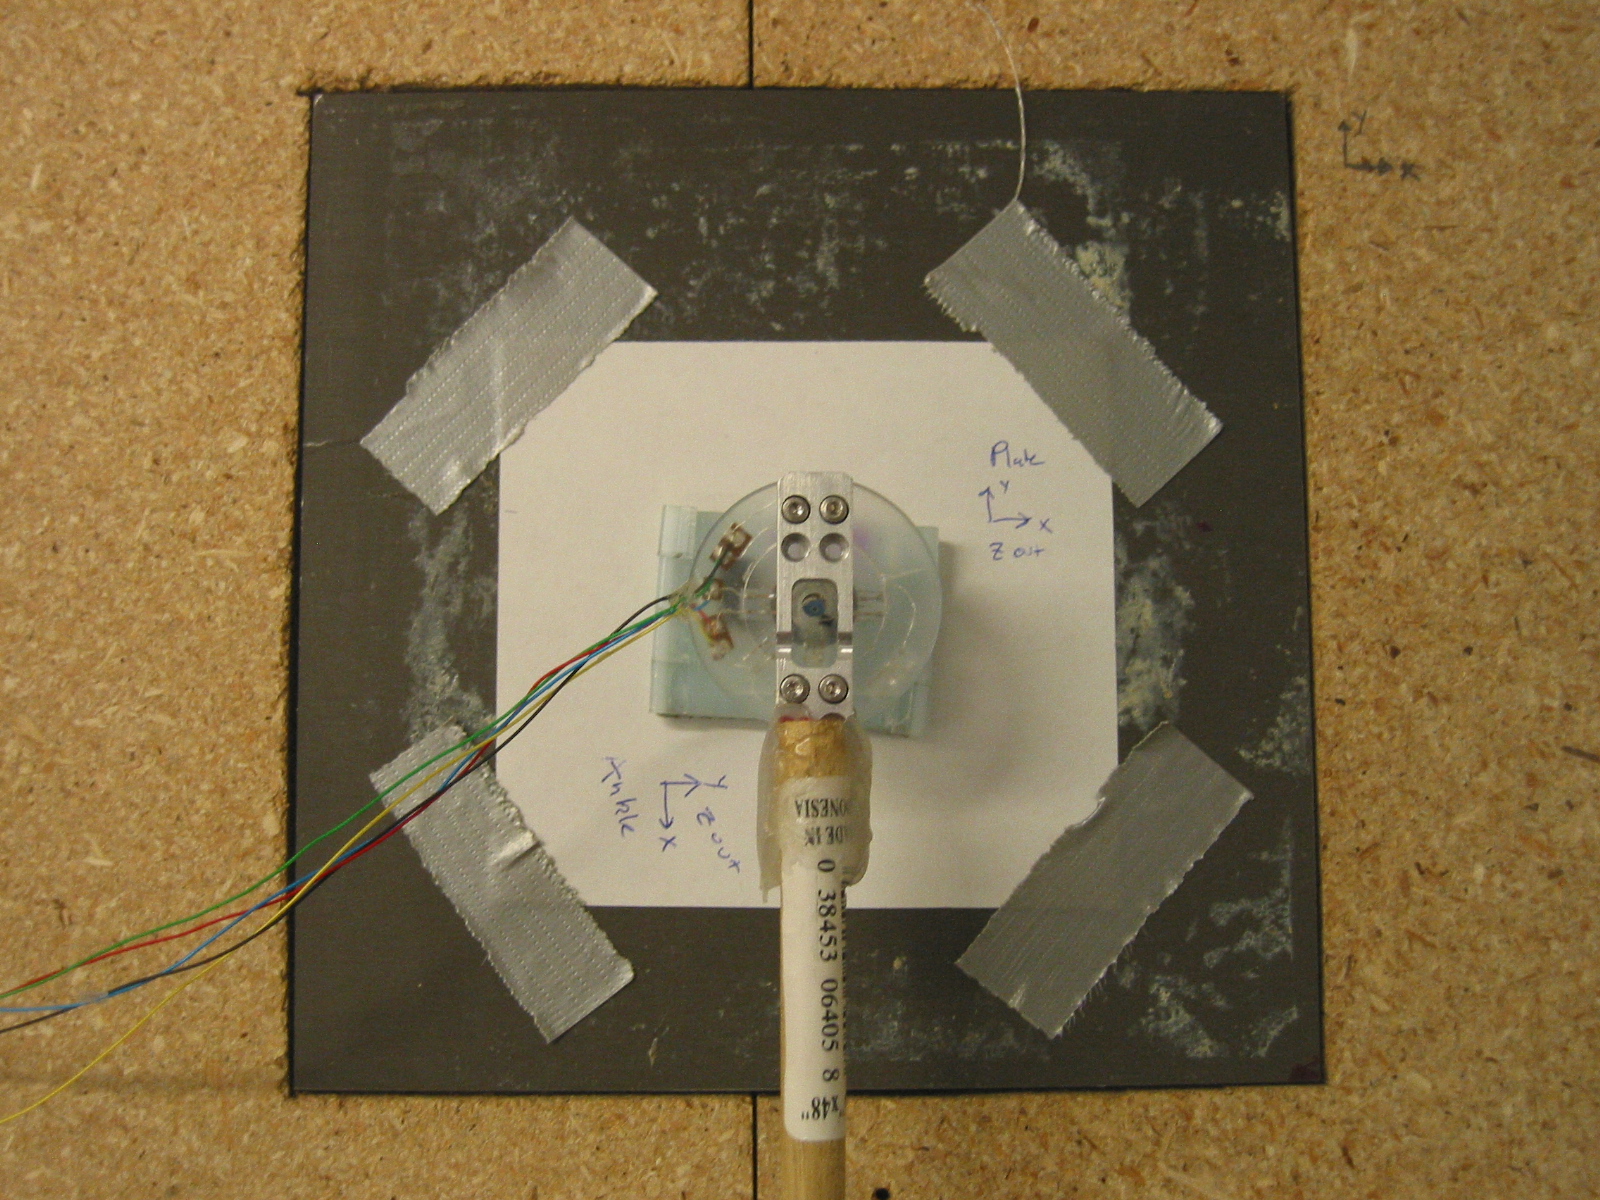
The force plate is at a different orientation from the ankle, so the cooridinate frame must be rotated 90 degree around the Z-axis. Also, The force plate will measure the forces on the plate, but we want the reaction forces through the foot, so we need to multiply all forces by -1.
For future reference, the wiring is as follows:
- Ankle-to-Amplifier wires:
- X = Green
- Y = Blue
- Z = Yellow
- 1.0v = Red
- Ground = Black
- Amplifier-to-LabVIEW wires:
- X = White
- Y = Yellow
- Z = Green
- Ground = Black
Calibration
LabVIEW was used to sample data from both the force plate and ForceSensingAnkle. The data rate was 1 kHz over a 45 second trial. The strain gauge data was filtered using a Gaussian window filter with a diameter of 100 msec. Second, creep is accounted for by producing an offset signal from a piece-wise linear signal, set to zero the signal when no forces are applied. (The no-force points are chosen manually.)
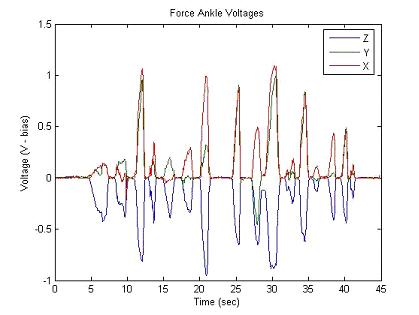
Raw Ankle Data Filtered Ankle Data
First, any reading where the magnitude from the force plate is less than a preset threshold is discarded. To find the calibration matrix, the force plate data matrix is multiplied by the psuedo-inverse of the ankle data matrix. To get the following result:
| 8.4732 | -1.7714 | 1.2175 |
| -5.8559 | -6.6459 | -9.9062 |
| -23.7120 | 7.1519 | -36.3181 |


Force Plate Transformed Force Ankle
Drift and Creep
The drift was measured by measuring the strains across a cold (recently powered) ankle for slightly less than a half-hour. The assumption is that current across the strain gauges will warm the ankle, causing the readings to drift. These are plots taken from the trial (the data is filtered over 1 second intervals.)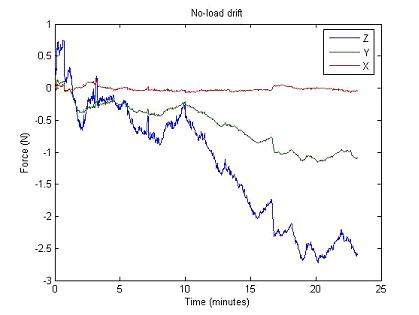
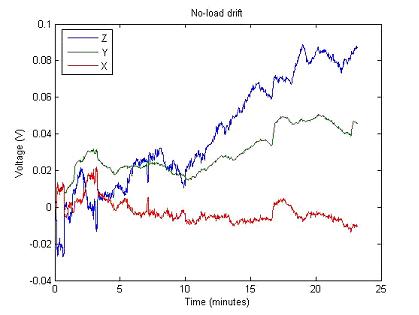
No Load Drift (Transformed to Netwons) No Load Drift (In Raw Voltage)
However, the drift is insiginificant when compared to the creep. If the force cell is loaded and released, the readings do not return to zero. We believe this is an unavoidable characteristic of the polyurethane the ForceSensingAnkle is made from. Any control algorithm must take this creep into account. Note in the following figure how the signals creep away from zero even over the short timespan of the trial. Also, note how the signals remain constant between loading.
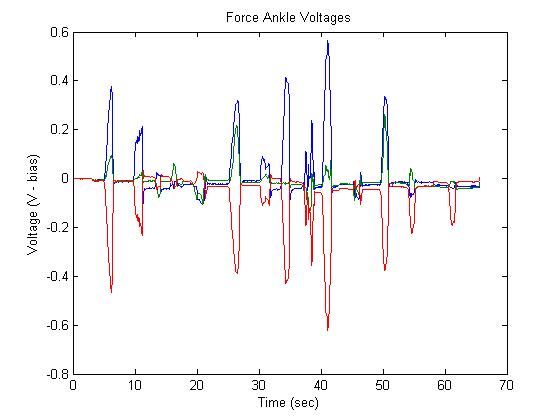
Raw Voltage from Strain Gauges
-- SalomonTrujillo - 06 Sep 2005
Ideas, requests, problems regarding TWiki? Send feedback