new web: http://bdml.stanford.edu/pmwiki
TWiki > Rise Web>TWikiUsers > SimonScheffel>FirstPrototype (29 Aug 2005, YongLaePark)
FSA Prototype 1 Fabrication and Test
People
SimonScheffel, YongLaePark with the help of: WillP and MiguelPiedrahitaConcept
Keeping the current ankle design in mind, integrate functionality which allows for measurment of normal and tangential forces which occur at the gecko's foot. The idea is to take incorporte a diapragm-flexure into the ankle shown below, to enable:- Normal Force measurement by monitoring compressive strain
- Shear Force measurement by monitoring differential bending
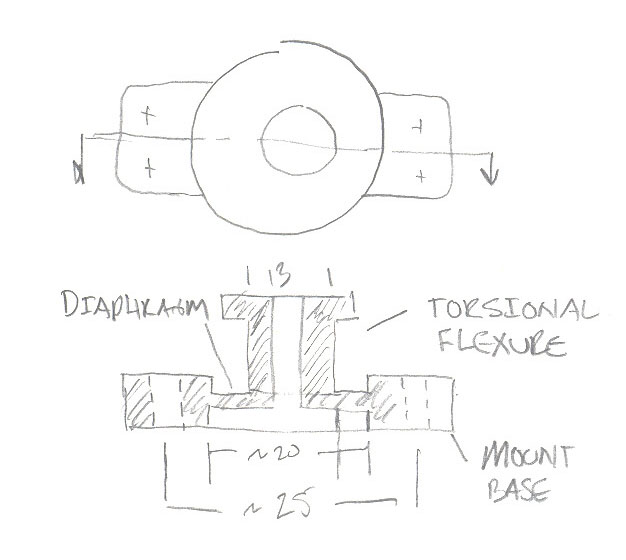
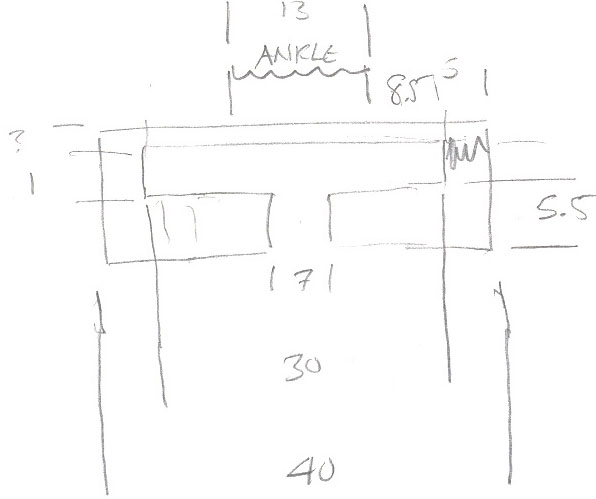
 The vision is to integrate a flexure which isolates the mounting holes of the ankle base from the torsional flexure (ankle), so forces may be transmitted through it, allowing strain gages embedded in the diaphragm to measure strain. Ideally, we could just reduce the thickness of the material that connects the torsional joint to the 4-hole plate. But, it may not be advantageous, since the lateral spacing between the ankle boss and mounting holes is about the same size as a gage section. At this point, we think it would be best for strain gages to reside in a "thin-wall" section, which is long enough to truly behave like a diaphragm (or beam in 2-d space), and displace when loaded through the ankle. So, the idea at this point (for the final design) is to create a diaphragm feature, which floats above the mounting holes (which are constrained by the RiSE robot's leg geometry). Below, some preliminary sketches reveal potential layouts of the force sensing ankle.
- Layouts featuring diapragm a)"in" the flange, b)"above" the flange:
First Prototype
At this point, we have decided to produce a simple prototype in order to charachterize how a PU diaphragm may function as an insturmental component. The sectional image below shows a simple plate, with diaphragm thickness, t and diameter, D. We will produce various "load cells", with three diaphragm thicknesses (1, 1.5, and 2mm) and two diaphragm diameters (~20mm and 30mm). We plan to embed pairs strain gages in a few of these load cells (maybe more if assembly is fast enough), at opposing sides of the diaphragm, so differential measurements may be used in observing bending forces due to applied moment about one axis. Also, Tensile and compressive forces may be observed. Below, the image shows two horizontal red lines, this shows approximate placement of the gages, which will be a little off of the diaphragm's neutral axis (centerline). Also, notice the ball-joint (shown in red). A ball-joint test fixture will be developed, which allows for transmission of tangential forces to the ankle joint, so bending in the diaphragm may be accurately charachterized by via loading experiments and calibration.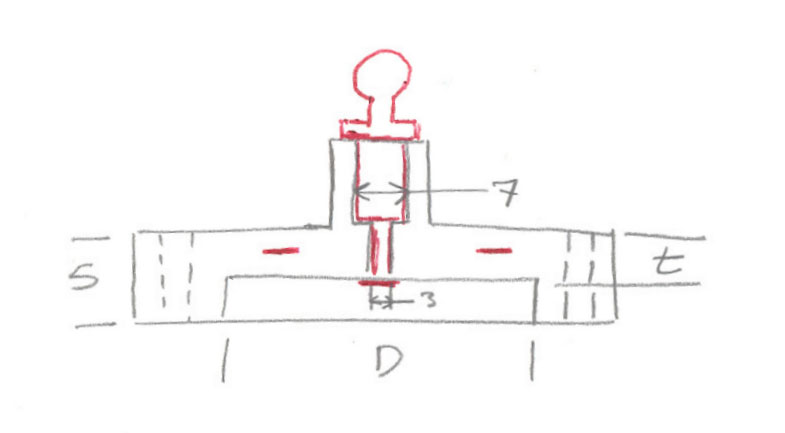
Prototype 1 Fabrictaion
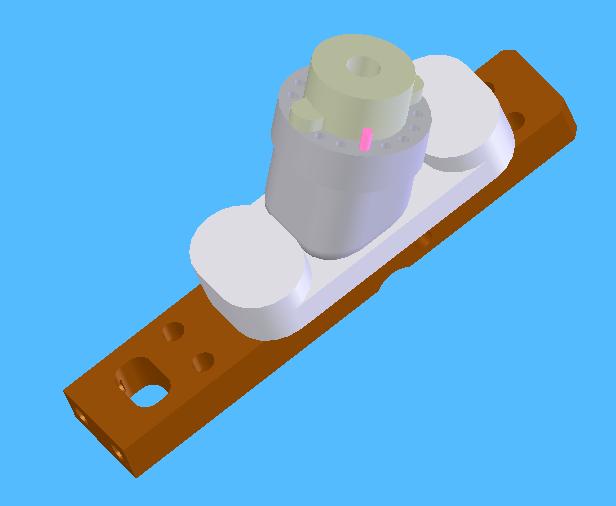
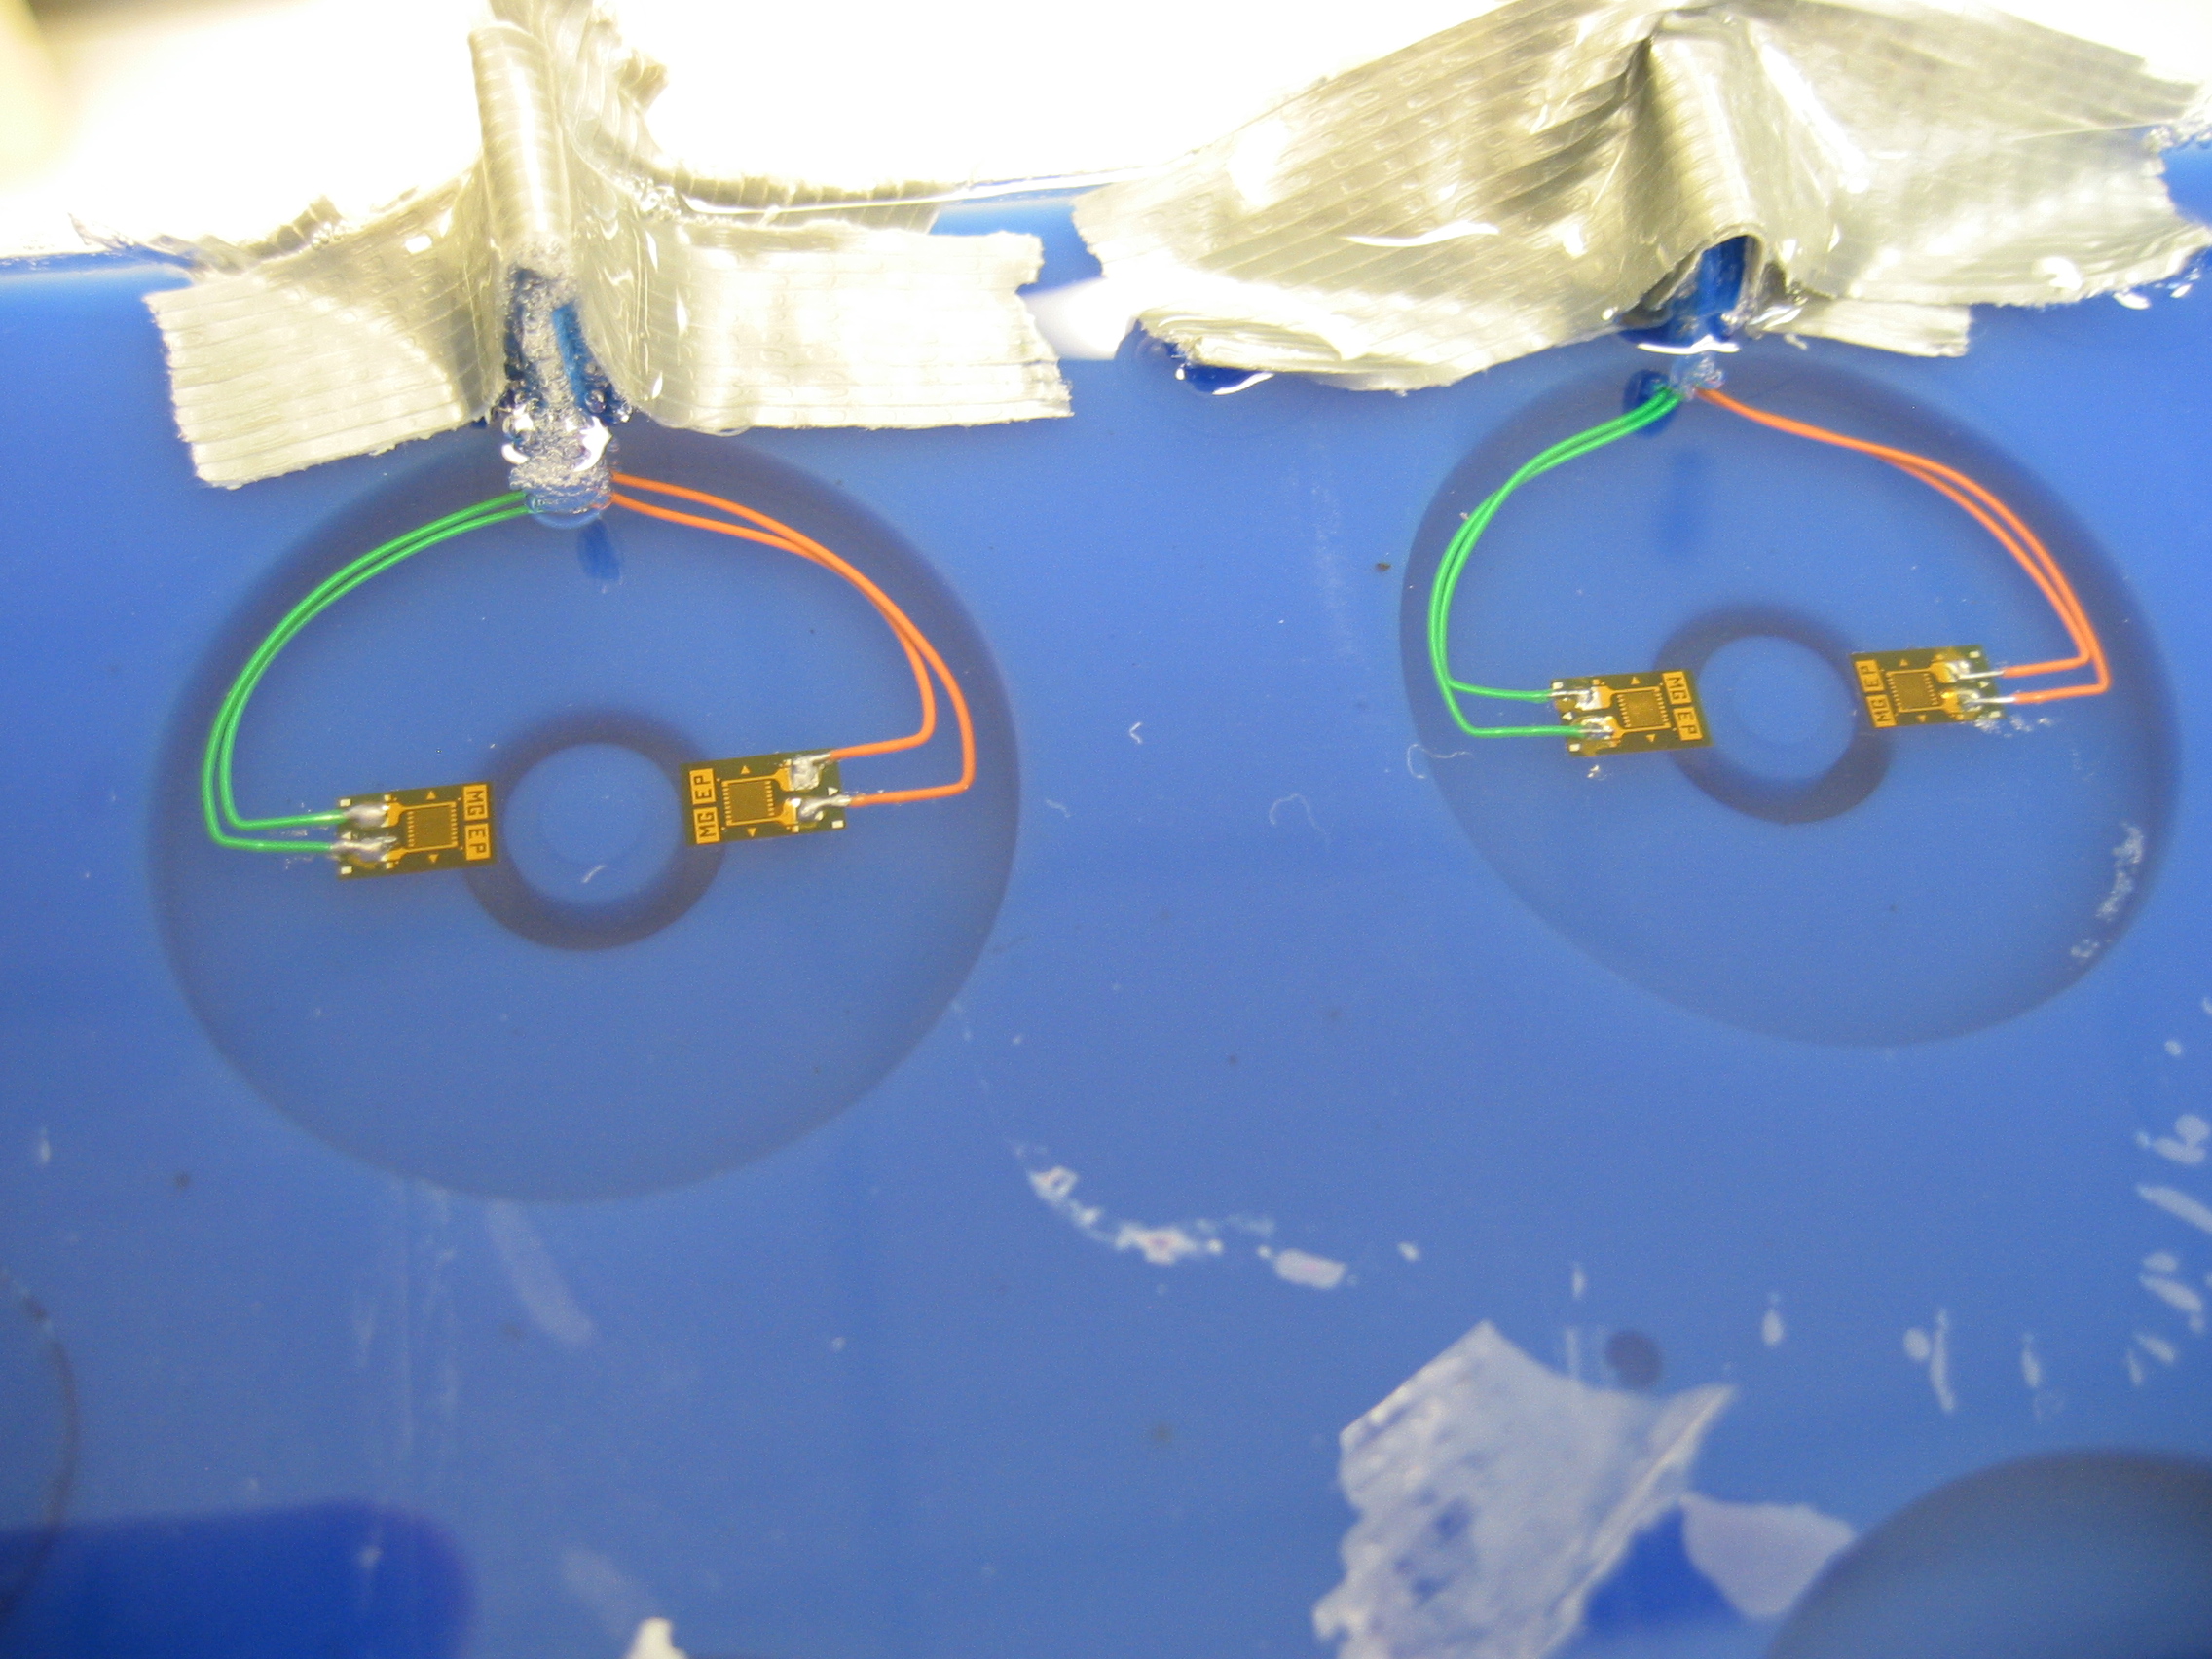
The two pictures below show the first couple of steps in this fabrication process. Pic 1 shows the strain gages mounted on the 1st quartile thickness of what will be the sensor's diaphragm, and Pic 2 shows the sensors after the final PU pour. Following this step, pockets will be machined, to create the diaphragm's thickness, and 4-hole patterns will be machined for mounting points.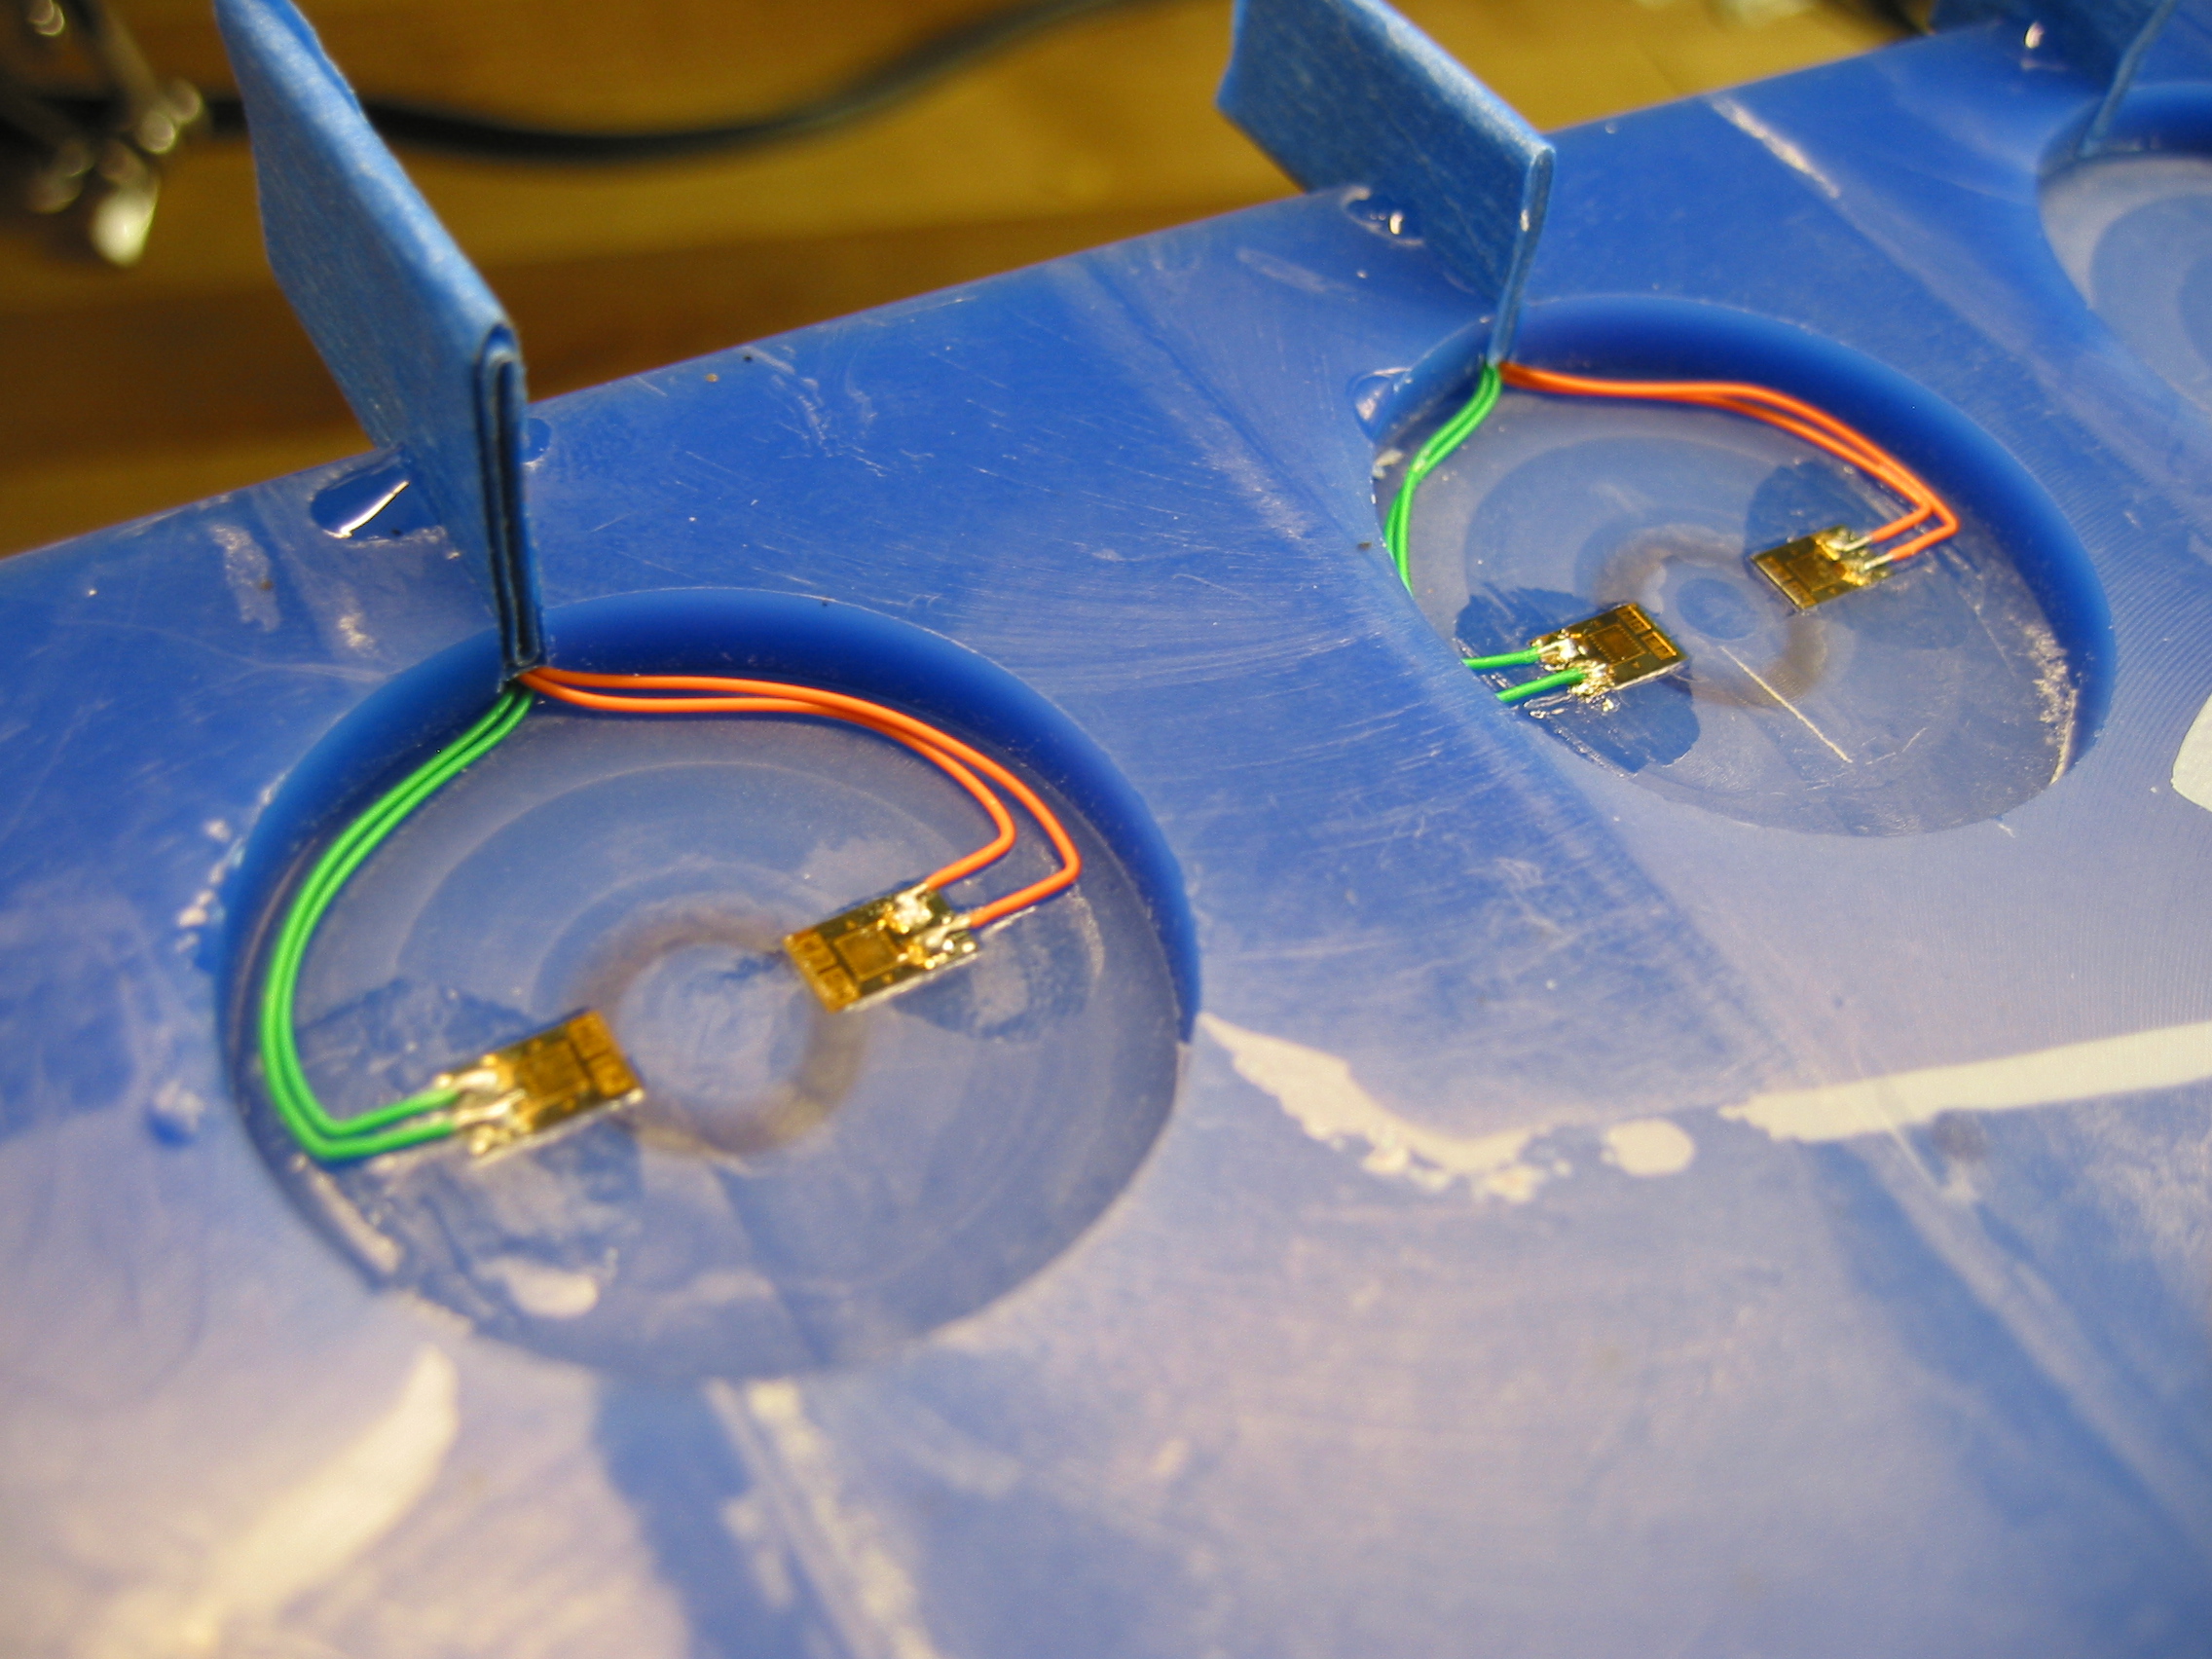
 -- SimonScheffel? - 11 Apr 2005
Force Calibration of Prototype 1
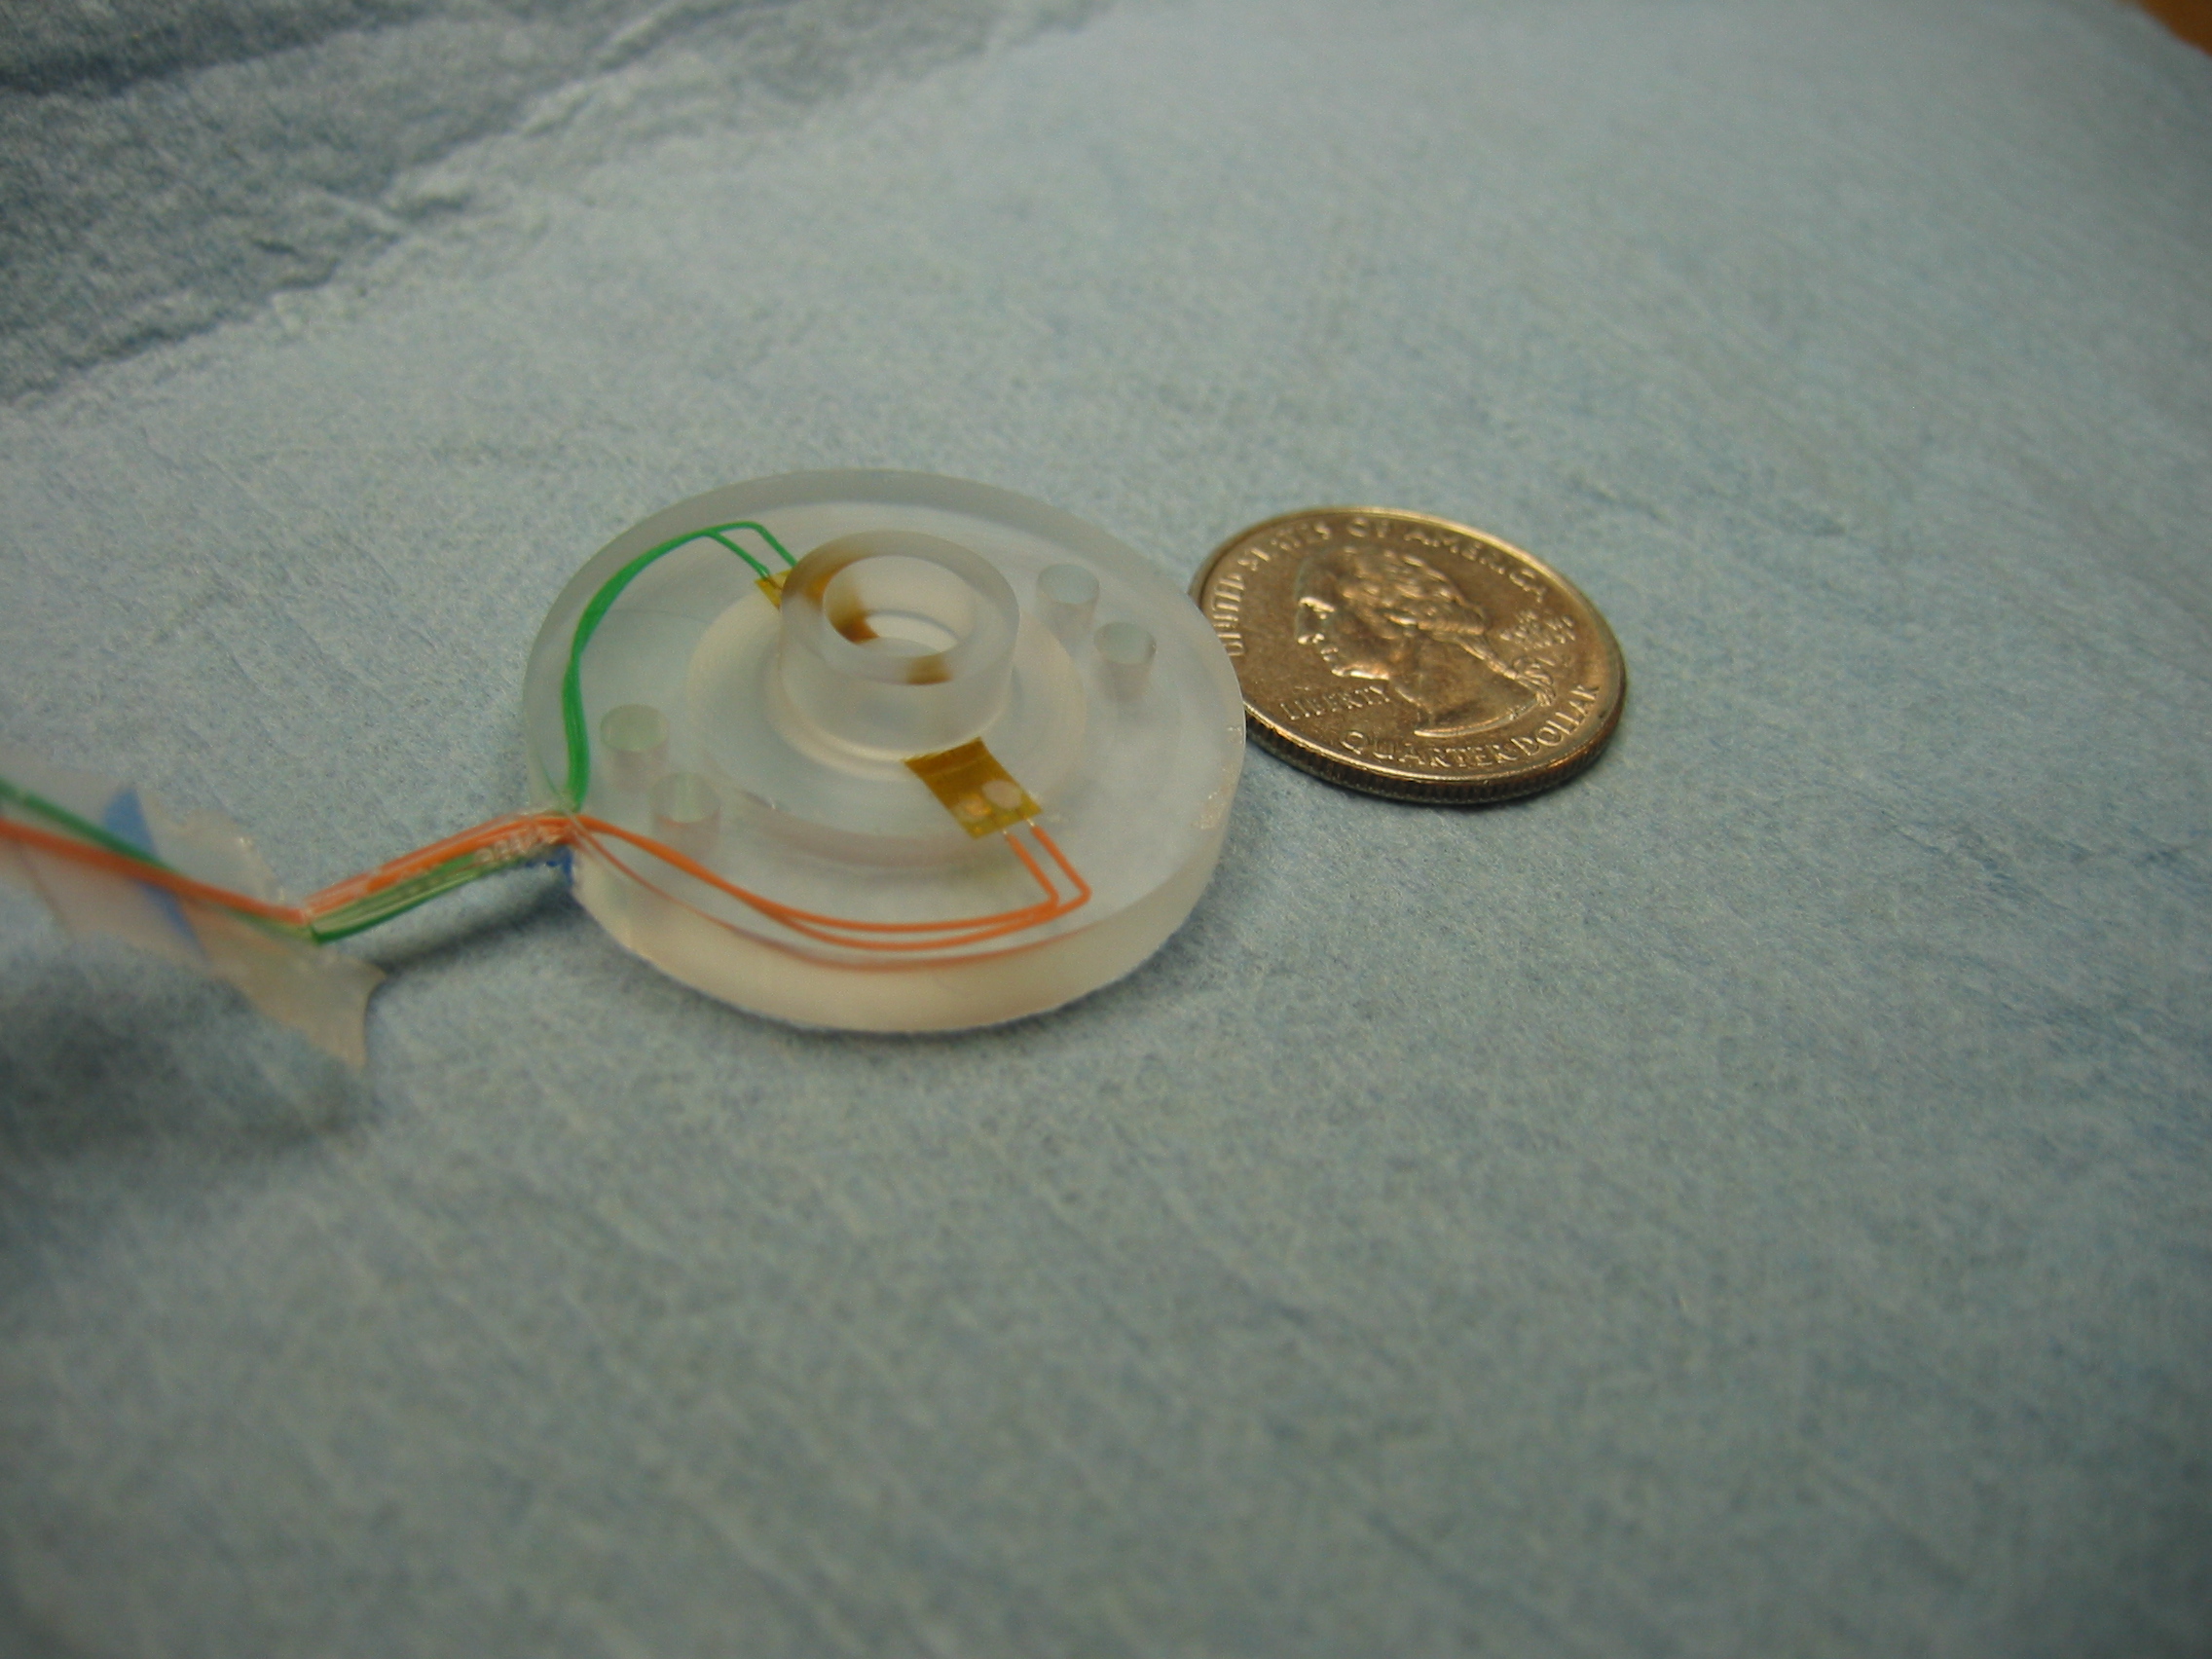
Force Calibration of Prototype 1 was conducted using a scale and a height gauge.- Prototype 1:
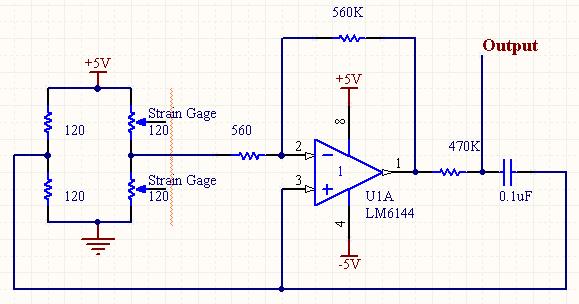
- Test Circuit:
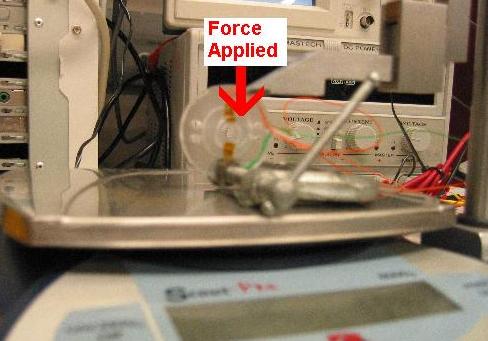
- Test Setup:
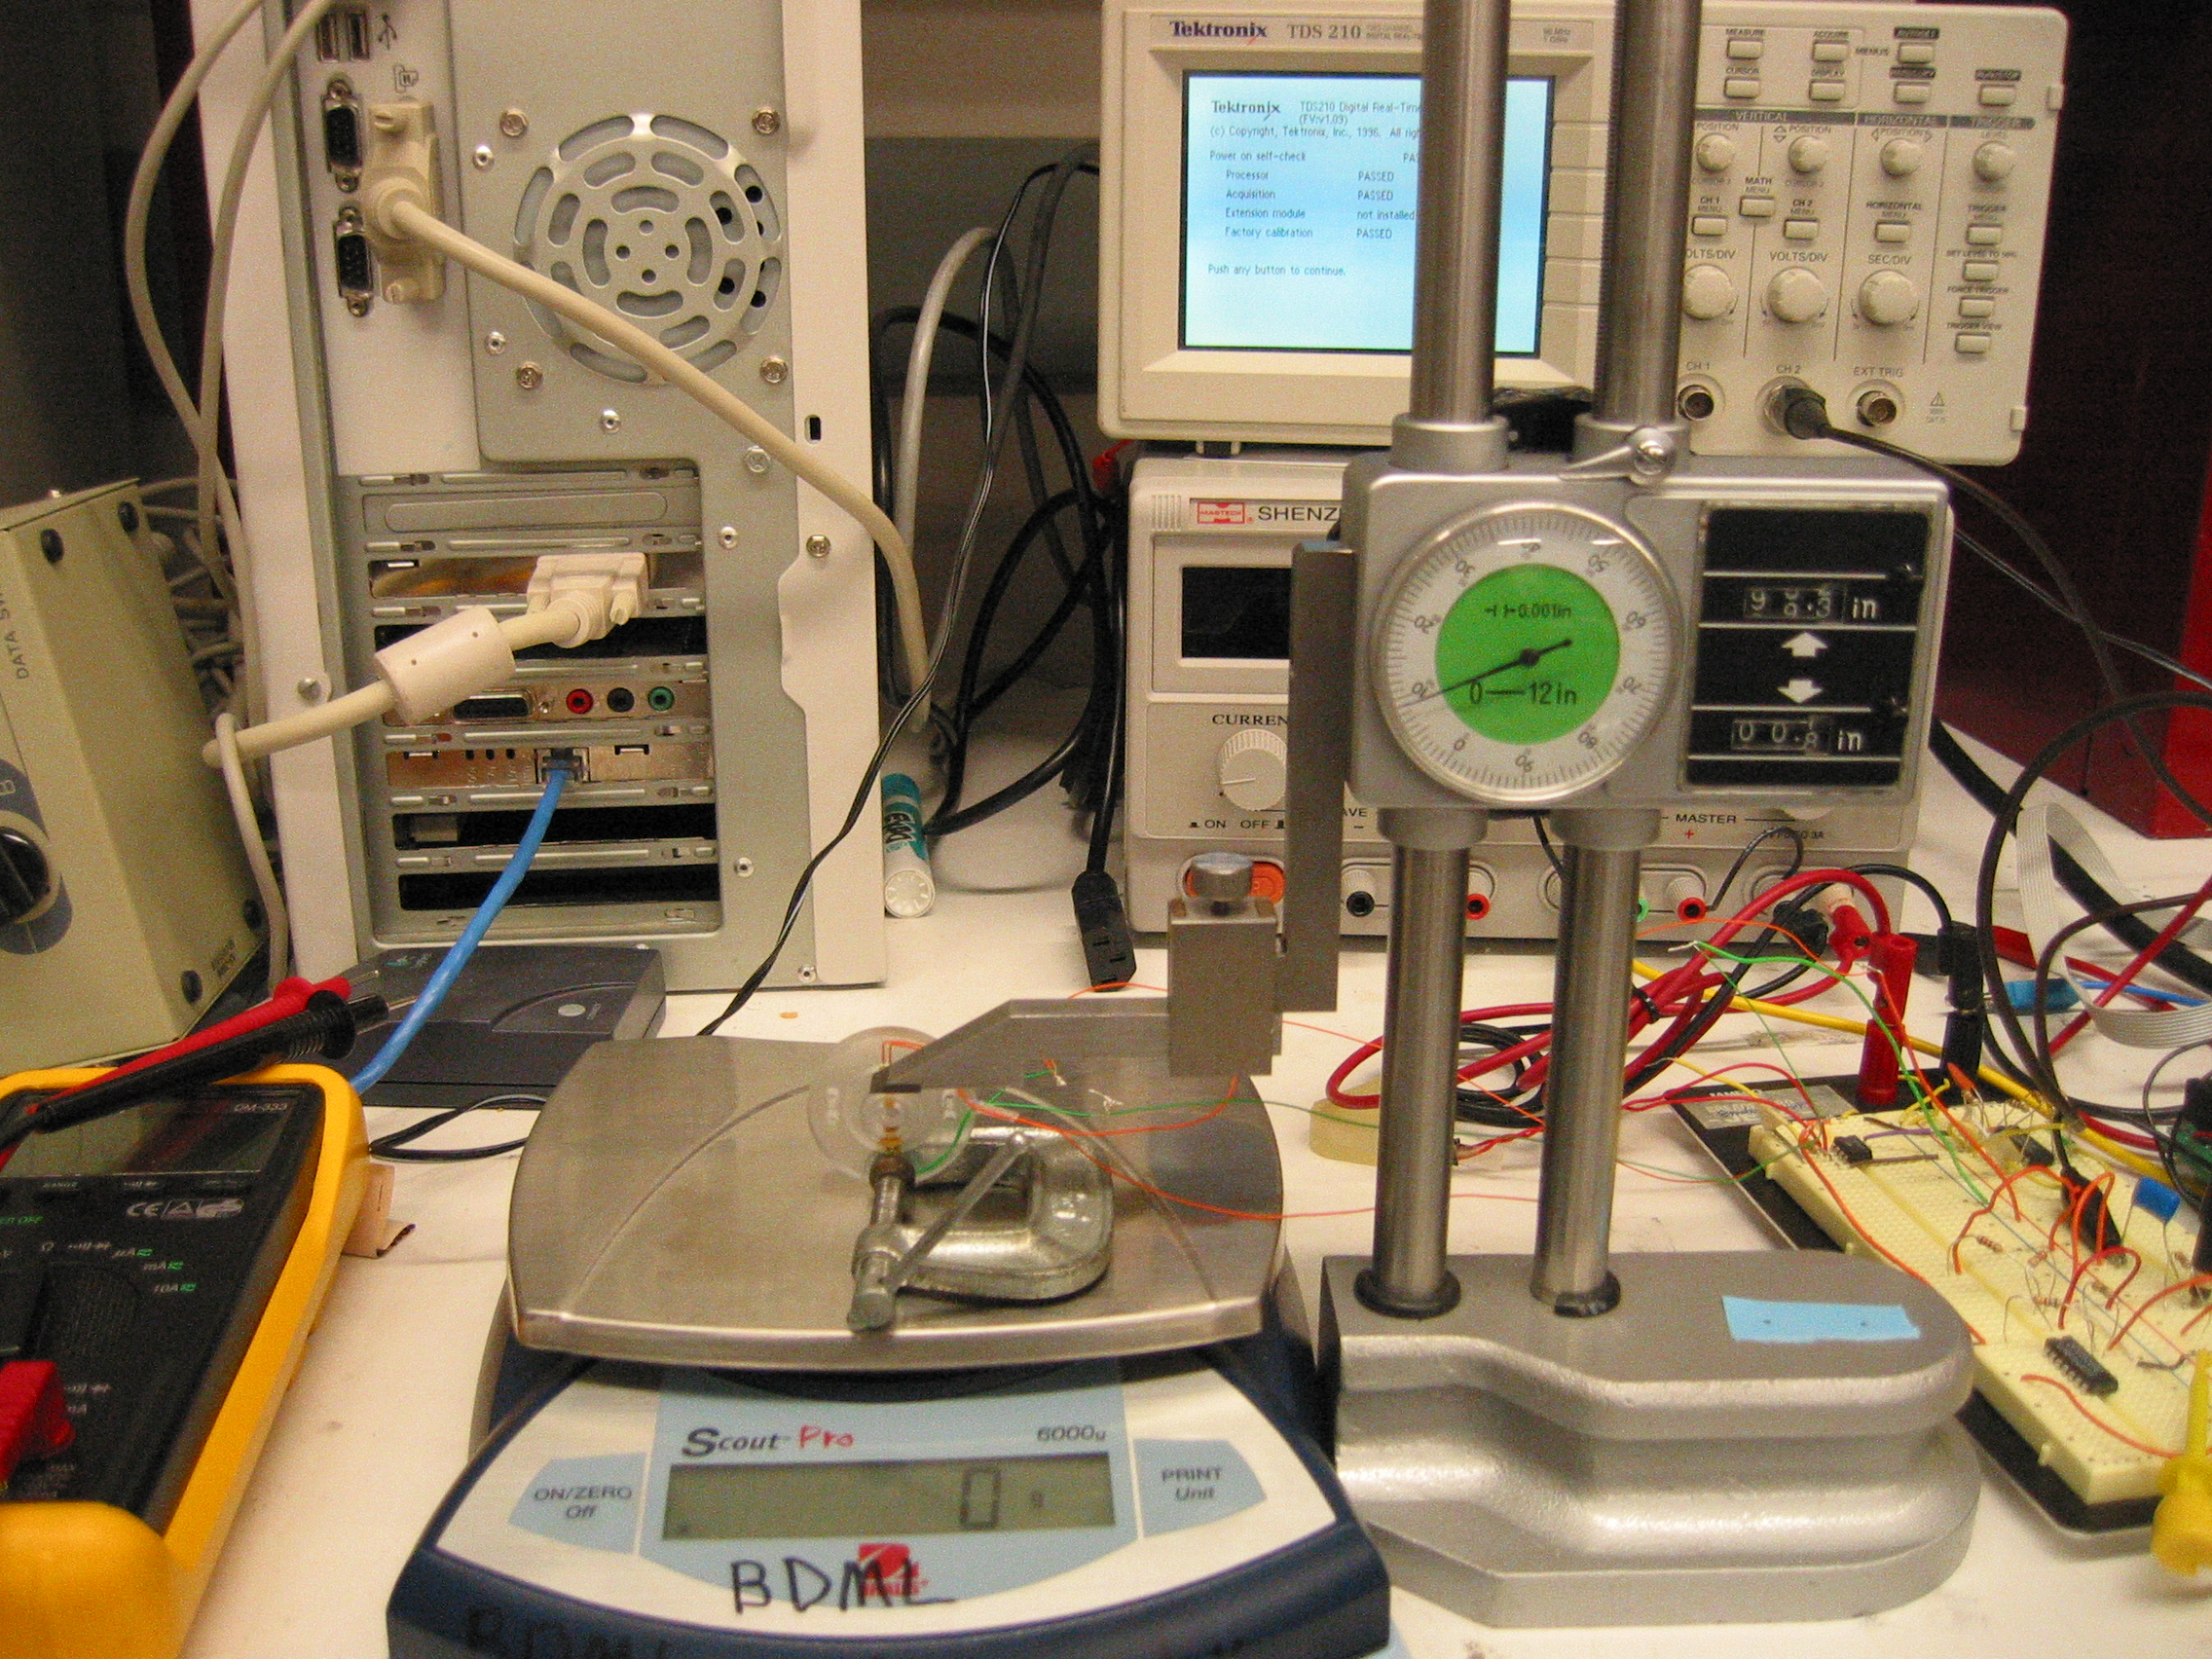
- Close Look of Test Setup:
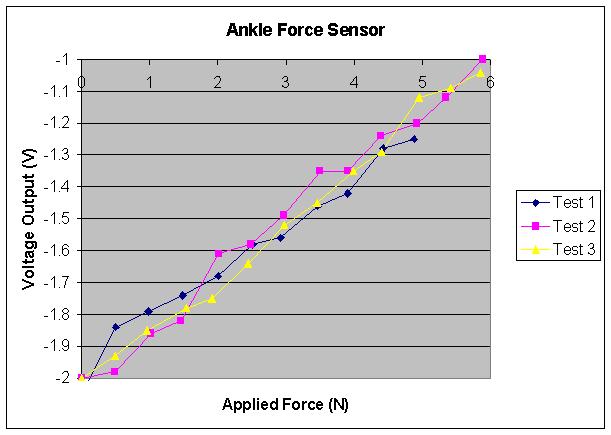
- Test Result:
Force Calibration of Prototype 1a
This calibration is similar to the one done on Prototype 1. The same tests were run on another transducer, which has a larger diaphragm (and theoretically more sensitivity due to decreased stifness). Experiment Meta Data:- "Large" Diaphragm
- -Diameter = 25mm
- -Thickness = 1mm
- 2-gage bending setup (same as test on prototype 1)
- -120-ohm metal foil strain gage, GF 2.065 (vishay EA-06-060LZ-120)
- -Gages bonded to diaphragm surface, not embedded in the "1st quartile"
- Static loading (~.5N incriments about every 30 seconds)
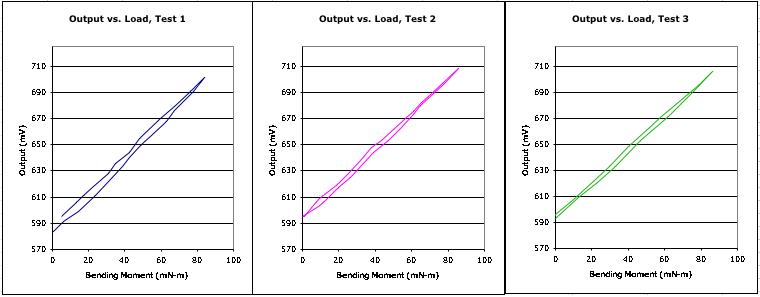
- 3 Hysterisis Plots:
Ideas, requests, problems regarding TWiki? Send feedback