new web: http://bdml.stanford.edu/pmwiki
TWiki > Rise Web>ClimbingRobot > StickyBot > StickyBotMechanical>CompliantWing (24 Aug 2007, AnnaShedletsky? )
Compliant Wing Design
Improvements to wing assembly to incorporate hall effect sensor to enable force feedback for increased reliability in dynamic climbing.Definition of Problem
The goal is to incorporate force sensing in the wing angle of SB's shoulder. This requires some compliance between the wing angle servo and the wing components, so that the angle of difference between the two can be measured with a hall effect sensor. A successful design will require:- Housing for the hall effect sensor and the magnets
- Compliant joint between the servo and the wing
- Rigid and robust once assembled -- despite multi-component assembly
Design Possibilities
This design works to fix several problems observed in earlier wing compliance attempts. I have edited the interface between the hard and soft polymers to prevent delamination. I have increased the servo attachment area and incorporated grooves for the servo to be glued into. The axis of the wing has been moved up 1.25 mm to allow for these grooves and for clearance with the soft polymer. Proposed Design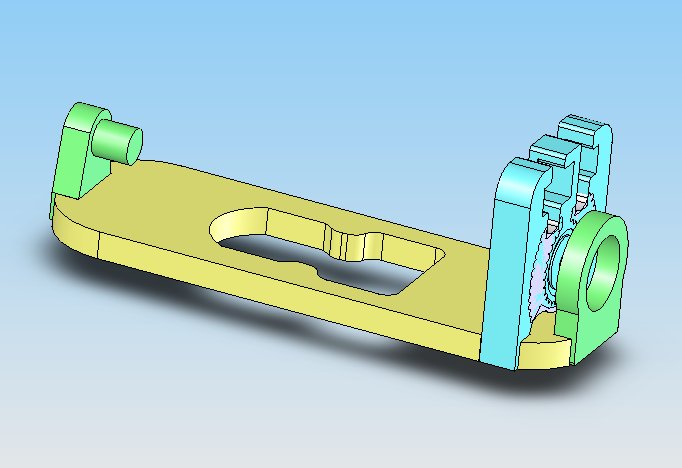 One concern about the above design is the increased thickness required for four-side housing of the hall effect sensor and magnets. In this design, I have decreased the thickness back to the "standard" SB limb thickness of 3 mm.
Thinner Compliant Component (Reduced Stiffness)
One concern about the above design is the increased thickness required for four-side housing of the hall effect sensor and magnets. In this design, I have decreased the thickness back to the "standard" SB limb thickness of 3 mm.
Thinner Compliant Component (Reduced Stiffness) 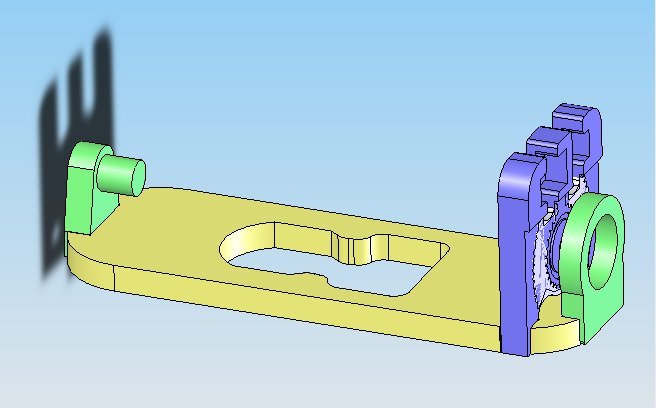 -- AnnaShedletsky? - 06 Jul 2007
Manufacturing
Machining
July 10-11: I machined the first prototypes on the Haas (my first CNC mill experience) and poured the hard polymer.Process Notes:
- Parts should be patterned using Unigraphics, not Solidworks -- and arranged in "repeatable clusters" instead of planning to repeat each part individually.
- I was planning on using the small 1/32" bit, but changed to the 1/16" at the last moment because the other tool was broken. Although I looked over my part files to ensure that all of the parts could still be cut, I missed several key locations and so had to reconfigure the parts for the 1/16" and a second machining pass. In retrospect, it would have been best to configure the parts for the 1/16" mill from the beginning, as it is significantly faster.
- Additionally, the short mill took about an hour to machine; the long mill took significantly longer (200% feed vs. 40% feed). In the future, it would be good for parts with with depths greater than what the short mill can handle (3-4 mm) to be made in a separate operation.
Construction
The difference between the two designs is the thickness of the soft polymer (4 mm or 3 mm). Small ledges on the second compliance piece allow for the hall effect sensor to be housed securely while the soft polymer cross-section is reduced. A clearance hole for the servo screw was drilled in place of the blue wax in the picture below. Compliance Pieces -- 2 Designs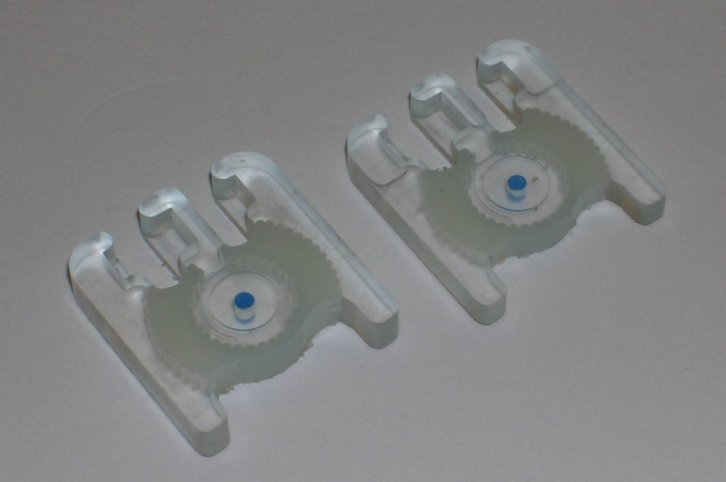 The picture below shows the fully constructed prototype. The servo will attach to the remaining core of the servo horn (I removed the horns to allow rotational clearance), and the wing will hang on the endpin at the far end.
Compliant Wing Prototype
The picture below shows the fully constructed prototype. The servo will attach to the remaining core of the servo horn (I removed the horns to allow rotational clearance), and the wing will hang on the endpin at the far end.
Compliant Wing Prototype 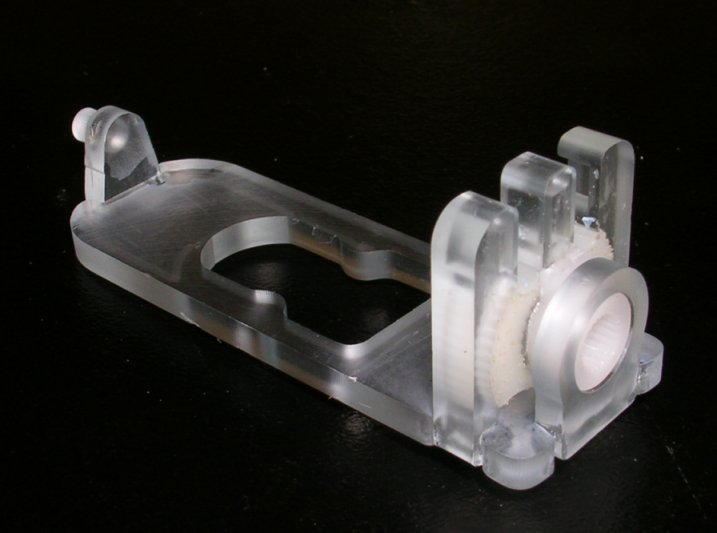 -- AnnaShedletsky? - 17 Jul 2007
Installation
Both of the wing prototypes were installed on SB in order to test their relative stiffnesses in comparison to the rubber bands currently in use. Both the 3 mm and 4 mm designs were compliant enough to allow SB to use its full range of wing motion without hitting the physical limits of the components. Once installed, the remaining design issue is whether the difference in stiffness between the rubber bands and the new compliance components is comparable enough that the software can account for it. Compliant Wings Installed on StickyBot -- AnnaShedletsky? - 20 Jul 2007
The stiffer version of the compliant wings (4 mm) were installed in combination with Barrett's TwoToeFoot. Preliminary testing demonstrates that the bot can stick to the glass surface, however, it has difficulty climbing because of the alignment of several of the components. Further testing will determine whether these can be tweaked in software, or whether physical changes are necessary.
-- AnnaShedletsky? - 24 Jul 2007
-- AnnaShedletsky? - 20 Jul 2007
The stiffer version of the compliant wings (4 mm) were installed in combination with Barrett's TwoToeFoot. Preliminary testing demonstrates that the bot can stick to the glass surface, however, it has difficulty climbing because of the alignment of several of the components. Further testing will determine whether these can be tweaked in software, or whether physical changes are necessary.
-- AnnaShedletsky? - 24 Jul 2007
Flexture Tests
Setup
I constructed a setup to measure the force exerted by the wing with various input angles of the servo. This was done by programming an extra circuit board to click the servo through various angles ion a range of less than 45 degrees. After some initial testing, I chose a resolution of 2/256 clicks to perform the tests, which yielded about 20 data points before the flexture reached its physical limit (the central tine on the compliant wing touching an outer tine, or the three-pronged servo horn making contact with the older wing surface). With each progressive click, the wing rotated (or the compliance stretched) 0.704 degrees and I recorded the force exerted by a 6.5 cm bar (similar to the actual foot distance on SB) on a digital scale with a resolution of 1 gram. Experimental Setup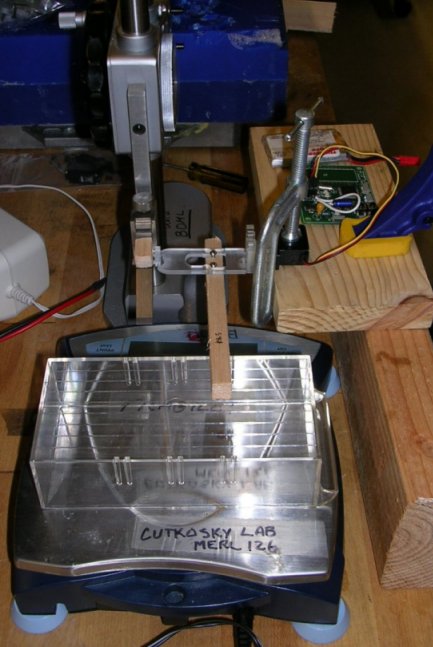 From this data, I was able to find the torque at the servo relative to input angles. I tested my two compliance designs which have thicknesses of 4 mm and 3 mm in addition to the current rubber band wings. I made the back wings during a different pour, and perceived a slight difference in stiffness, so I also measured the difference between the front and back for the 3 mm wing. Full data is available as an attachment: wingtorquetests.xls.
Results: Comparing Designs
Torque at the Flexture Relative to Angle -- Individual Tests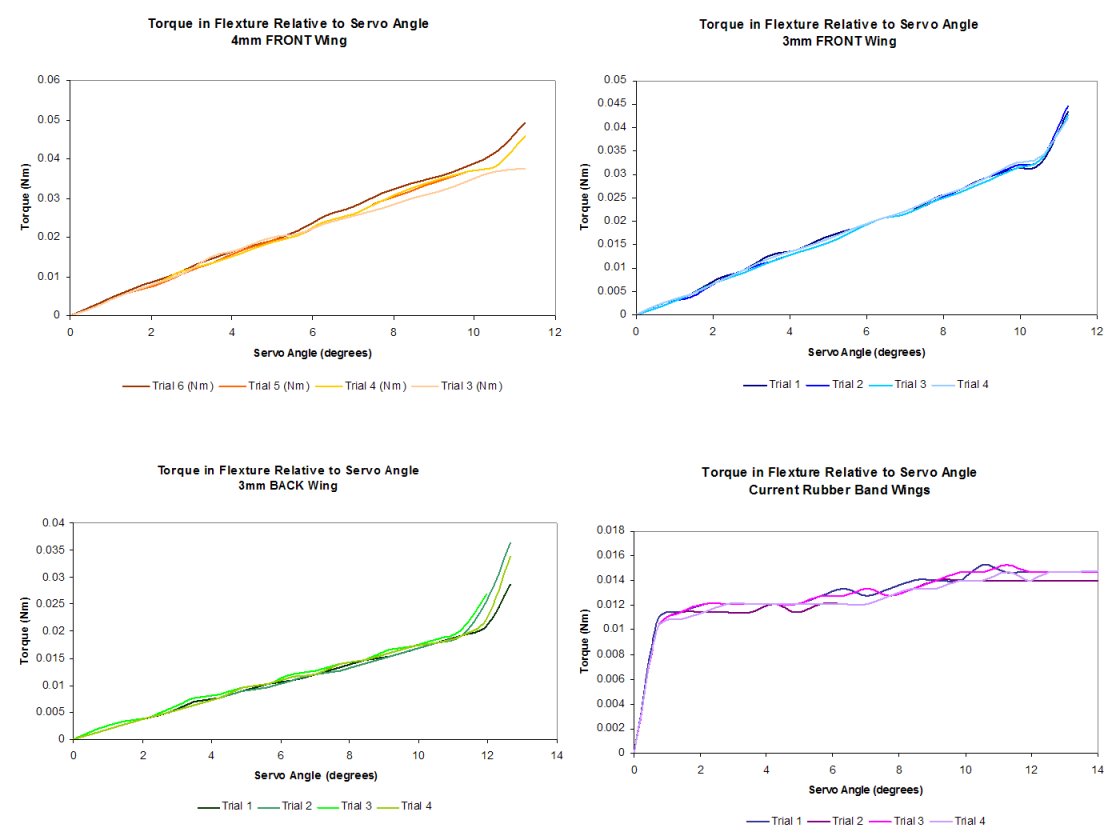 The compliant wings have relatively consistent and linear performance throughout multiple trials. There were some inconsistencies observed during the testing process -- where the value on the scale would change over time. This can be explained by the resolution of the scale (grams) and possible relaxation of the compliance joint. This relaxation was especially apparent in the rubber band, and accounts for the variability between trials and from step to step in the test.
Comparision Between Four Designs
The compliant wings have relatively consistent and linear performance throughout multiple trials. There were some inconsistencies observed during the testing process -- where the value on the scale would change over time. This can be explained by the resolution of the scale (grams) and possible relaxation of the compliance joint. This relaxation was especially apparent in the rubber band, and accounts for the variability between trials and from step to step in the test.
Comparision Between Four Designs 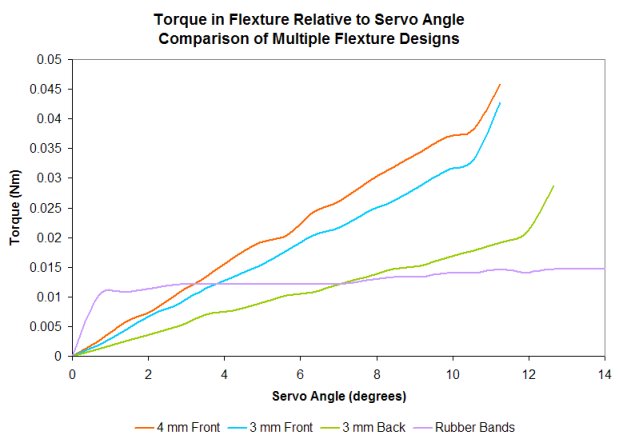 Spring Constant K for Each of Four Designs
 | 4 mm FRONT | k = 3.80 E-4 Nm/Deg |
| 3 mm FRONT | k = 3.29 E-4 Nm/Deg |
| 3 mm BACK | k = 1.74 E-4 Nm/Deg |
| Rubber Band | k = 0.43 E-4 Nm/Deg |
- The expected trend between the 4 mm and 3 mm designs -- the 4 mm design is 13.4% stiffer than the 3 mm design (these were made in the same pour of polymer)
- There is a significant difference in the stiffness between the 3 mm front wing and the 3 mm back wing (the back wings are nearly half as stiff). These were made during two separate pours of IE-20A and the results show that the pour had a greater affect on stiffness than cross-sectional area and physical design.
- The rubber band exhibited a very different curve than the rest -- I believe this is because of the slight amount of play between the three-pronged servo horn and the wing itself. For most the of the trial the servo was just traversing the angle gap and stretching the rubber band, but not exerting any additional force.
Results: Rubber Band Testing
I took the opportunity to do additional testing on the rubber band wings while things were setup. Since there was such a large disparity between the two different pours of the IE-20A, I wondered if such a disparity would exist between the rubber bands -- the different colors of which were probably not from the same pour. I found that the stiffnesses were relatively consistent: Comparison Between Two Rubber Bands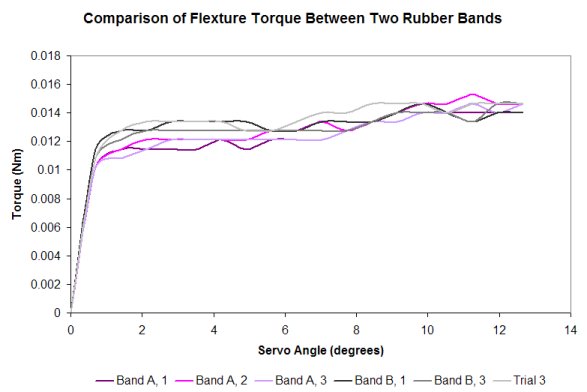 The second idea for a test was to determine the differences in stiffness relating to the angle of the rubber band. SB was designed so that the rubber band positioning could be adjusted with a second servo horn. For these trials I positioned this second servo horn at both its typical 80 degree position, and then at a more modest 45 degree position (see below).
Rubber Band Angle Setup
The second idea for a test was to determine the differences in stiffness relating to the angle of the rubber band. SB was designed so that the rubber band positioning could be adjusted with a second servo horn. For these trials I positioned this second servo horn at both its typical 80 degree position, and then at a more modest 45 degree position (see below).
Rubber Band Angle Setup 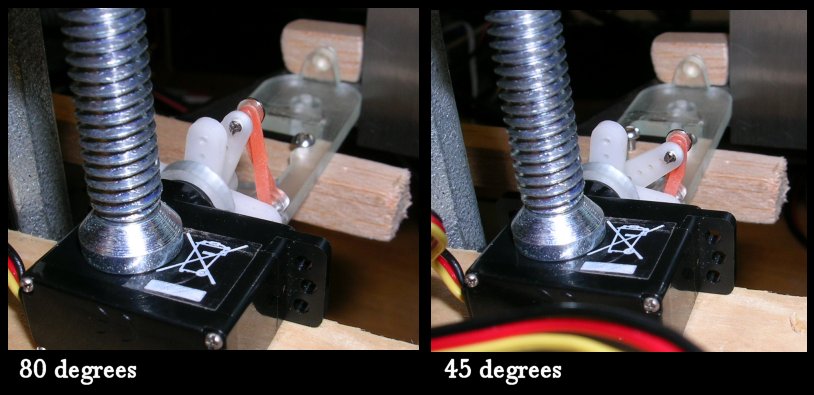 The results of this test show that the rubber band at the decreased angle does not apply as much torque but does have a higher k value. Both of them maxed out around the same torque because of their common physical limitation of the three-pronged servo horn hitting the wing.
Comparison of Different Rubber Band Angles
The results of this test show that the rubber band at the decreased angle does not apply as much torque but does have a higher k value. Both of them maxed out around the same torque because of their common physical limitation of the three-pronged servo horn hitting the wing.
Comparison of Different Rubber Band Angles 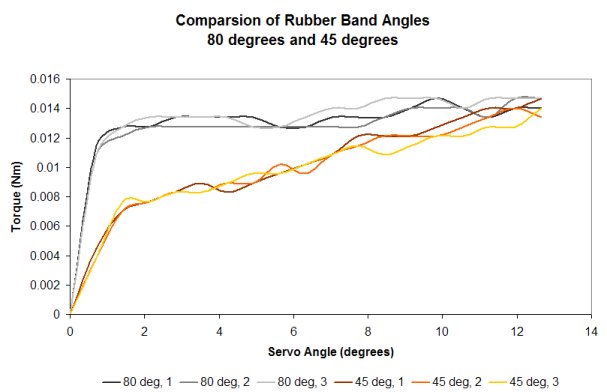 -- AnnaShedletsky? - 27 Jul 2007
Sensor Installation
Each hall effect sensor was pretested before it was soldered onto a piece of wire tape leading to a 4-prong connector which fits into the one on the sensor board. The soldered connection was then insulated with hot glue to prevent the leads from being pushed together and causing a short. The magnets were installed (red sides in, the red side defined as the side facing up when stuck to a piece of metal in the lab) using a piece of tape to lower the magnet into position and a stub of nonferrous wire to hold it in place while the glue dried. This method worked exceedingly well and allowed me to install the sensors without taking the robot apart. Each of the sensor connections was then troubleshooted using the real_time_graph matlab code -- a few of the connections between the receiver for the 4-prong connectors and the board were either severed or shorted. Sal tracked these places down and resoldered them. -- AnnaShedletsky? - 15 Aug 2007Sensor Calibration
Setup and Collection Processes
The setup included a stand that positioned SB2 over a digital gram scale such that its feet in home position grazed the surface. SB2 was taped to the stand using a small amount of double-stick tape to reduce the tendency for the robot to lift itself up during the testing. The force testing included both pushing down and pulling up. In order to pull up, the scale was tared with a 200 gram weight and SB2's foot was harnessed so that it would lift the weight. SB2 was tested in the range from +30 up from home and -50 below home. Several testing methods were tried, including ones where significant time elapsed between each click and ones which proceeded with very little pause. It was found that there was relatively little difference between these methods; more pertinent factors included the length of time between testing (which sometimes caused drift) and testing without warming the flextures. Each test cycle proceeded as follows:- Position SB2 over the scale and plug in battery
- Run matlab program (StickyBot_GUI)
- Push Home Position button to verify correct "zero" spot
- Tare the scale and tare the force sensors
- Run through the 30 to -50 range several times to warm the flextures
- Reverify that the scale and force sensors still appear to be tared -- do so again if necessary
- Begin at +30 and proceed down to -50
- Wait a second and then take 3 force snapshots approximately .5 seconds apart
- Record digital scale reading
- Repeat
- Go through matlab output and enter into Excel spreadsheet -- averaging the three snapshot values (since there is a lot of noise in the force sensors)
Data
Input: x = Sensor Reading (ADD Clicks, Average of 3 data snapshots for each point)Output: y = Force Applied by Foot (N) Some Observations:
- The orientation of some of the curves needs to be reversed in order for them all to be the same.
- Hysteresis was observed in most trials around the origin (flat spots in the graphs around 0). When the limb wash brought down onto the scale one tick at a time, the scale often remained at zero for much longer than if the limb was brought down to -2, back up to 0, then down to -3, etc. This could be because of hysteresis in the scale and/or hysteresis in the joint itself. In some of the charts below, the regression has been calculated without the hysteresis, just for comparison, as it will be possible to mitigate it in software.
- In most cases, the 2nd order polynomial fit has an r^2 value of .99, while the linear regression is usually somewhere around .95 even after outliers have been removed. This suggests that it may be worth the extra computational power to use a polynomial relationship between ADD clicks and force -- something which would take more computational power. The implementation of a lookup table may reduce the calculation restraints.
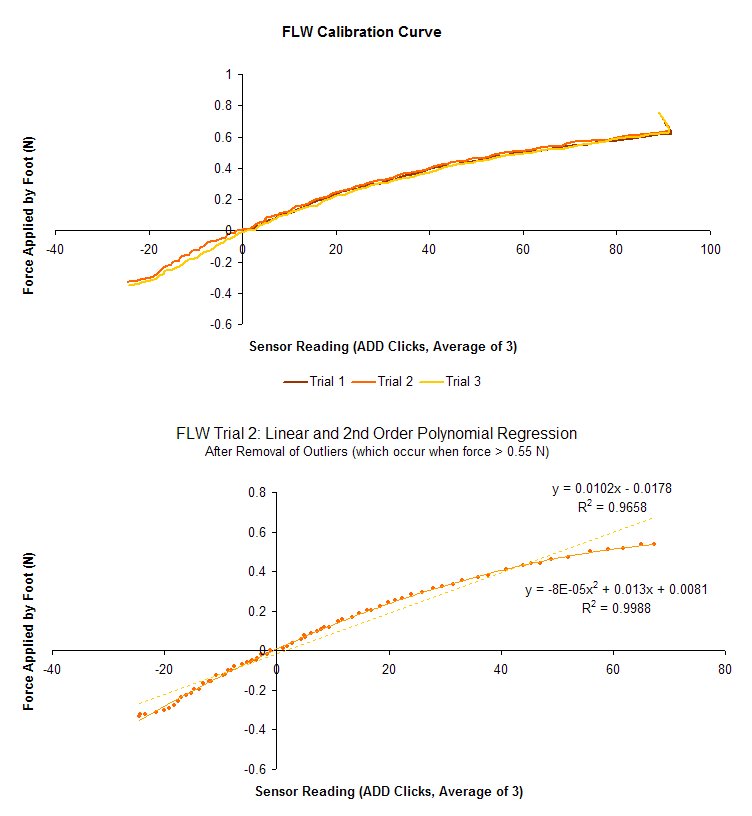 Front Right Wing Calibration Curves
 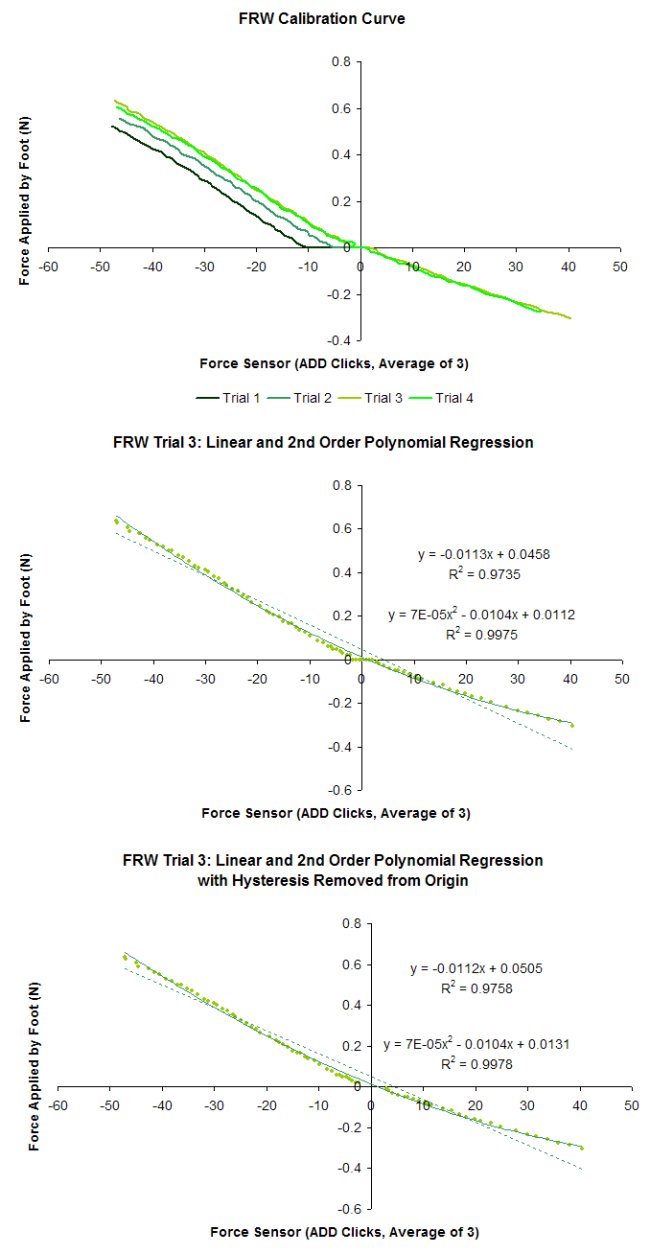 Back Left Wing Calibration Curves
 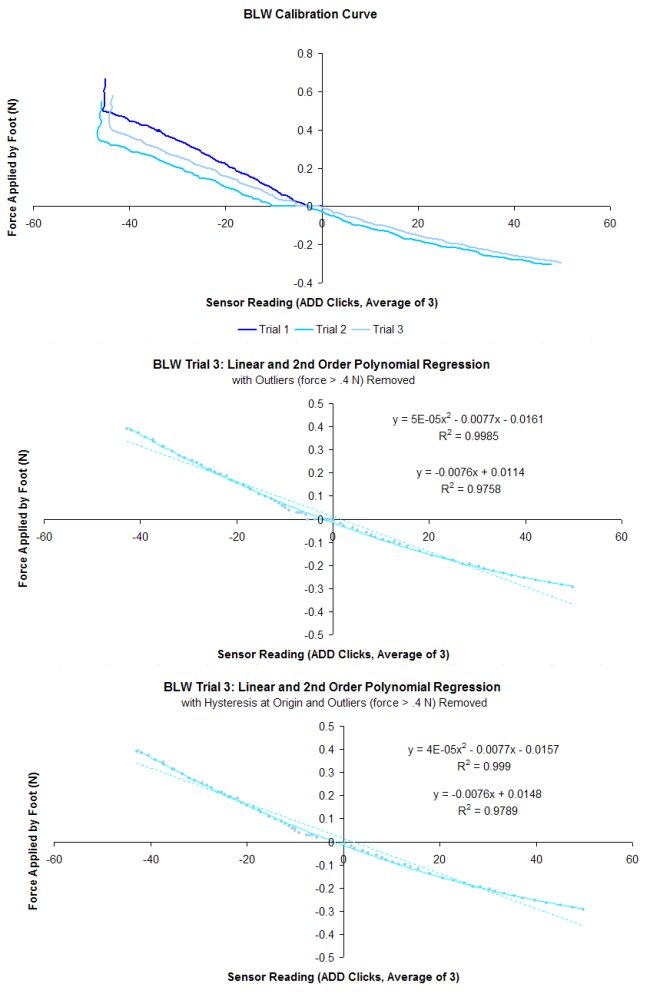 Back Right Wing Calibration Curves
 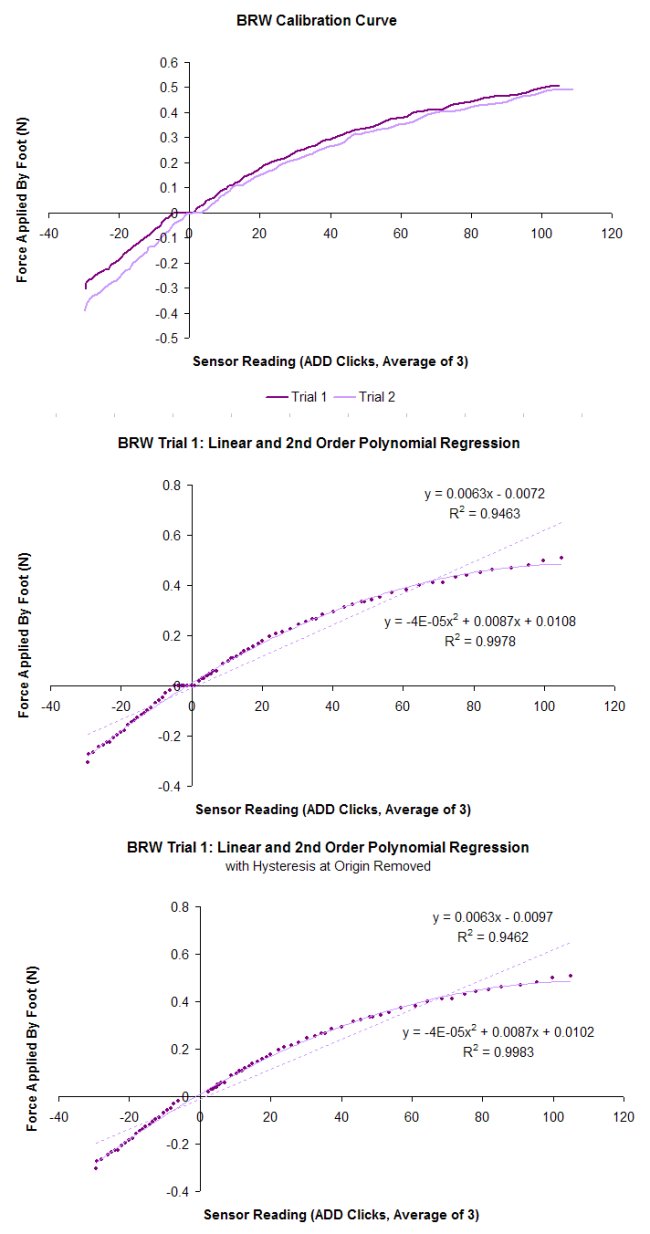 The graphs above represent the force measured as the leg is moved down from 30 to -50. An additional test was done to explore the possible hysteresis in the system by running the foot from 30, to -50, then back up to 30. The plot is included below. The bottom series of points are from the first operation of pushing down on the scale, and the return is when the foot is going up. At the resolution of the hall effect sensors (with all of the noise), there is not a significant difference between moving down and moving up.
Load Cycle
The graphs above represent the force measured as the leg is moved down from 30 to -50. An additional test was done to explore the possible hysteresis in the system by running the foot from 30, to -50, then back up to 30. The plot is included below. The bottom series of points are from the first operation of pushing down on the scale, and the return is when the foot is going up. At the resolution of the hall effect sensors (with all of the noise), there is not a significant difference between moving down and moving up.
Load Cycle 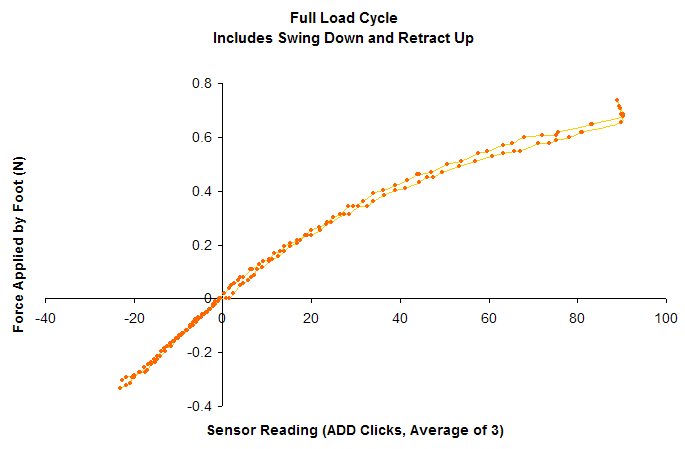 -- AnnaShedletsky? - 22 Aug 2007
Software
Ideas, requests, problems regarding TWiki? Send feedback