new web: http://bdml.stanford.edu/pmwiki
TWiki > Zman Web>RoughnessData (01 Sep 2009, NoeEsparza)
Preliminary Roughness Data (LANL)
Here is a good reference article from Wikipedia which helps with some of the roughness abbreviations. There is a nice table in the article with the subscripts. Wikipedia ArticleGlass Samples (Glass Slide, Fine - Satin, Medium - Small Hammer, Rough - Large Hammer)
Notes: Ok, so there are multiple files in here. The following is a breakdown of what they are..pdf's
These are the outputs of the stylus profilometer that I used for the macro scale roughness
of the glass. I did not do one for the glass slide, of course. I called the glass fine,
medium, and large in terms of the scale of the macro scale roughness, rough being the large,
longer ripples. Contact me if you dont understand what I meant. I did two passes on each
piece of glass. The profile you see isthe 'hills and valleys' profile of the glass.
Pretty self explanatory. Roughness variablesare printed on the bottom of the sheet in Angstroms.
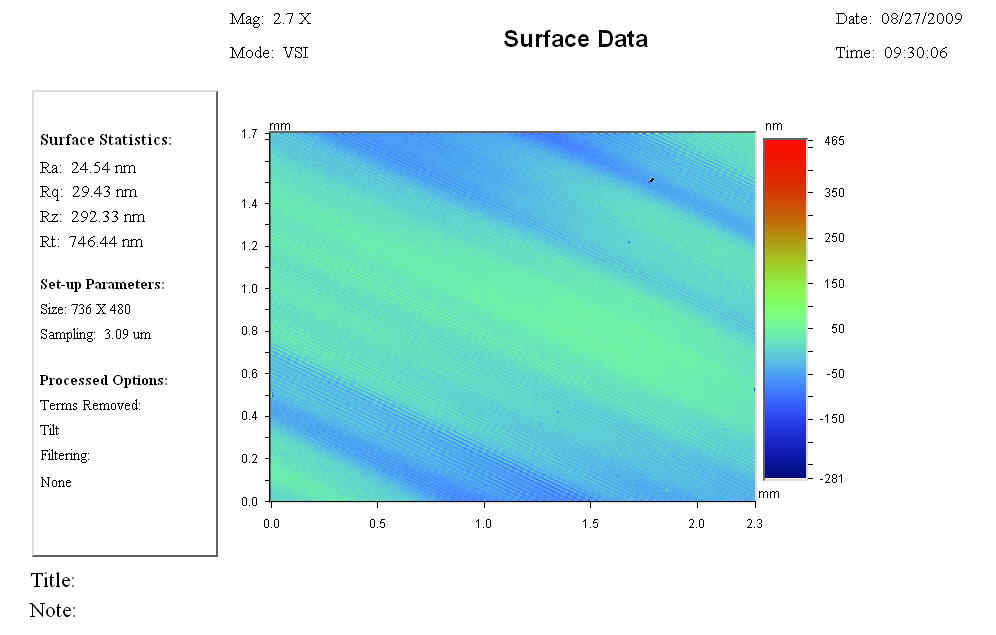
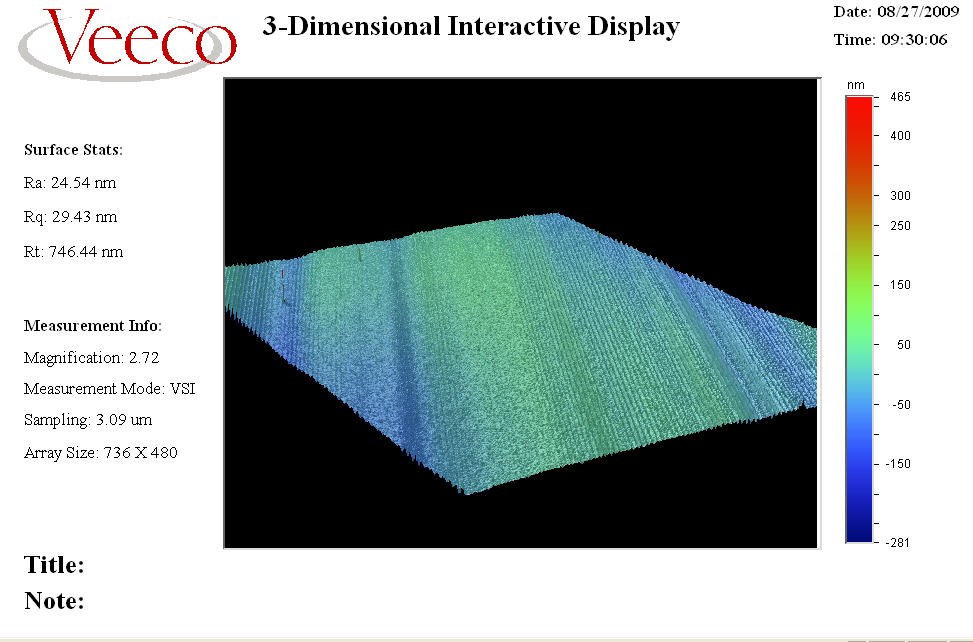
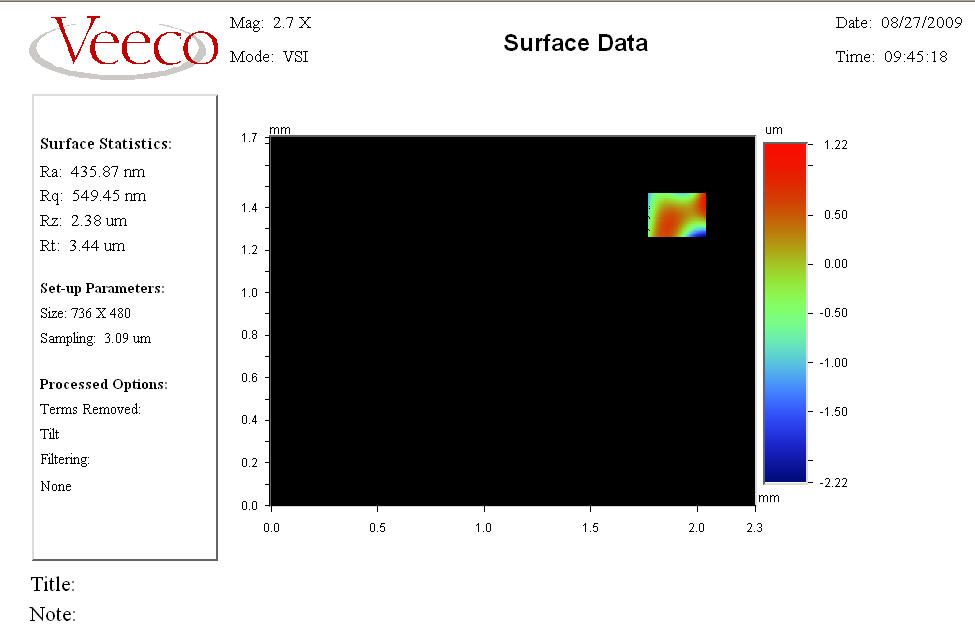
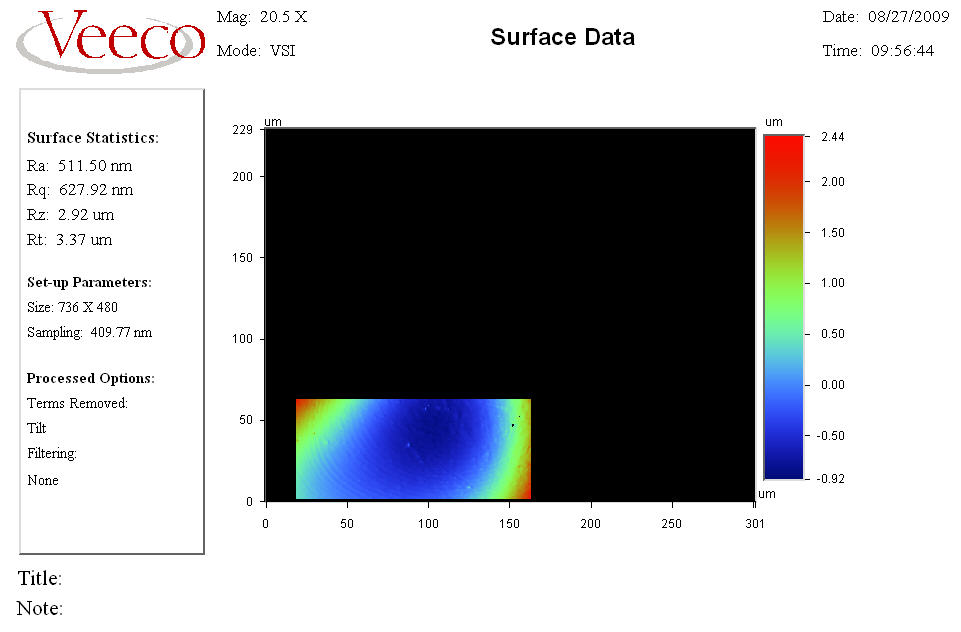
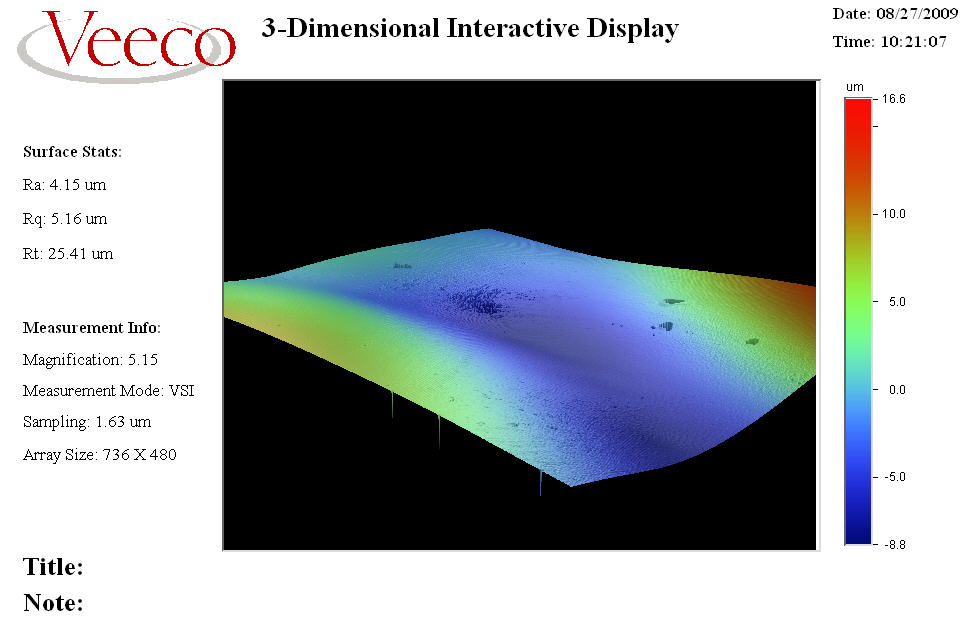
Pictures
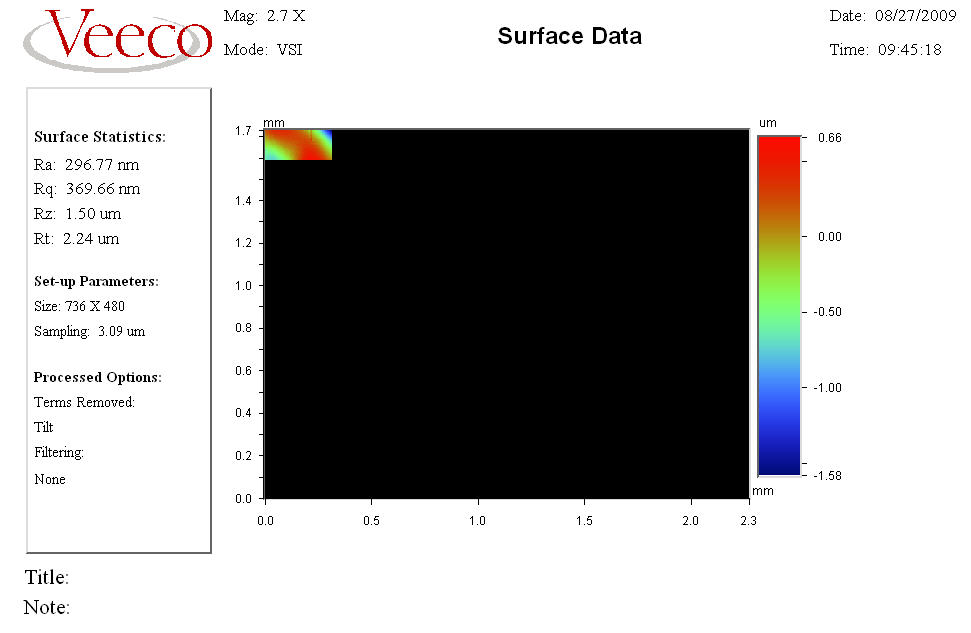
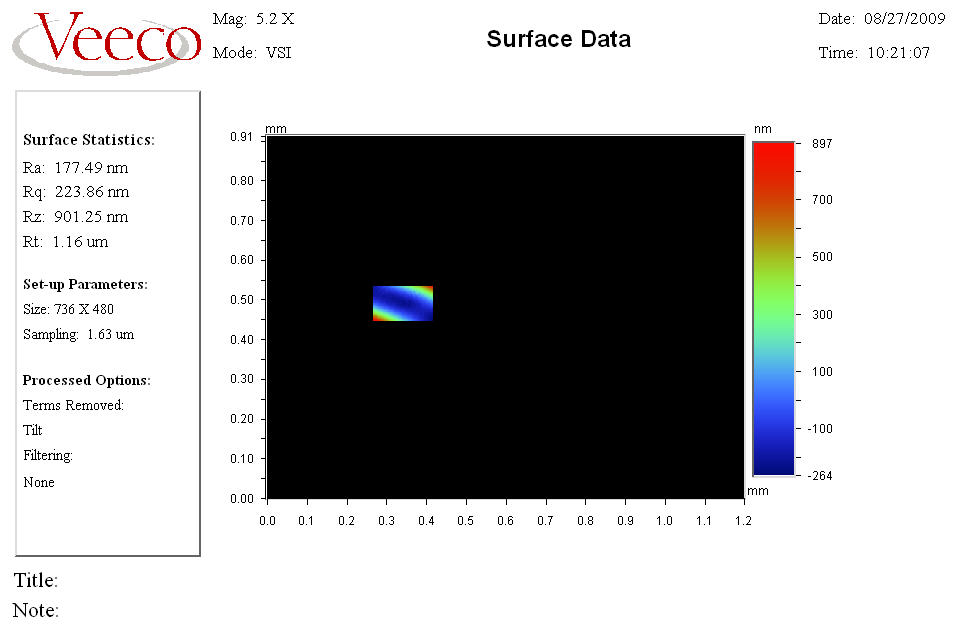
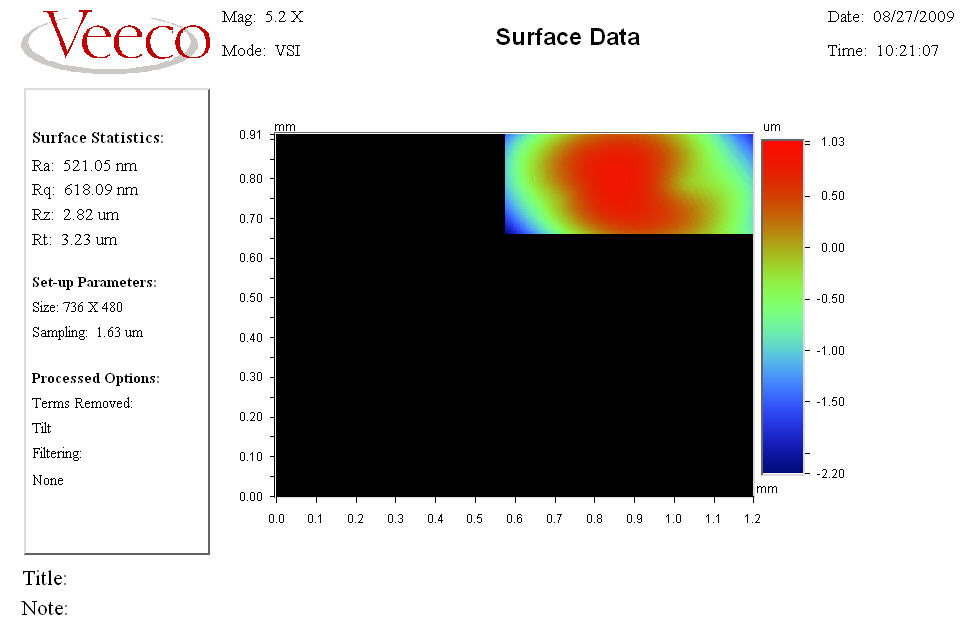
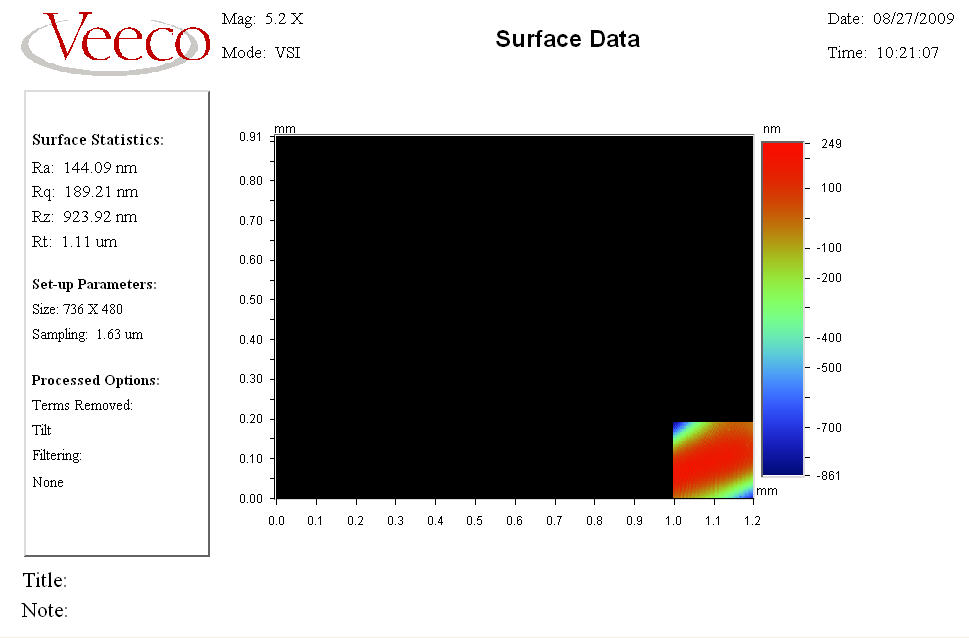
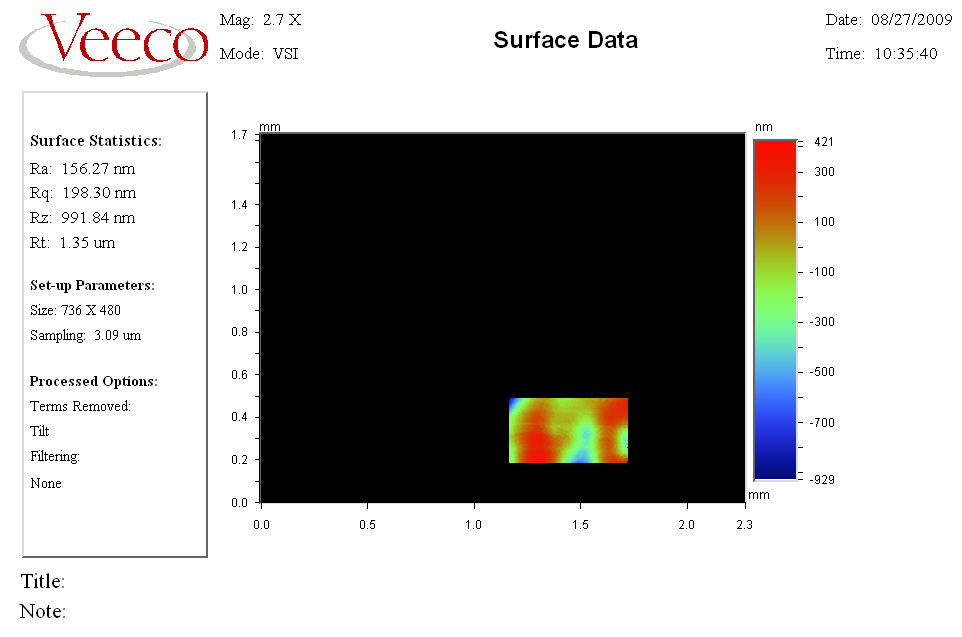
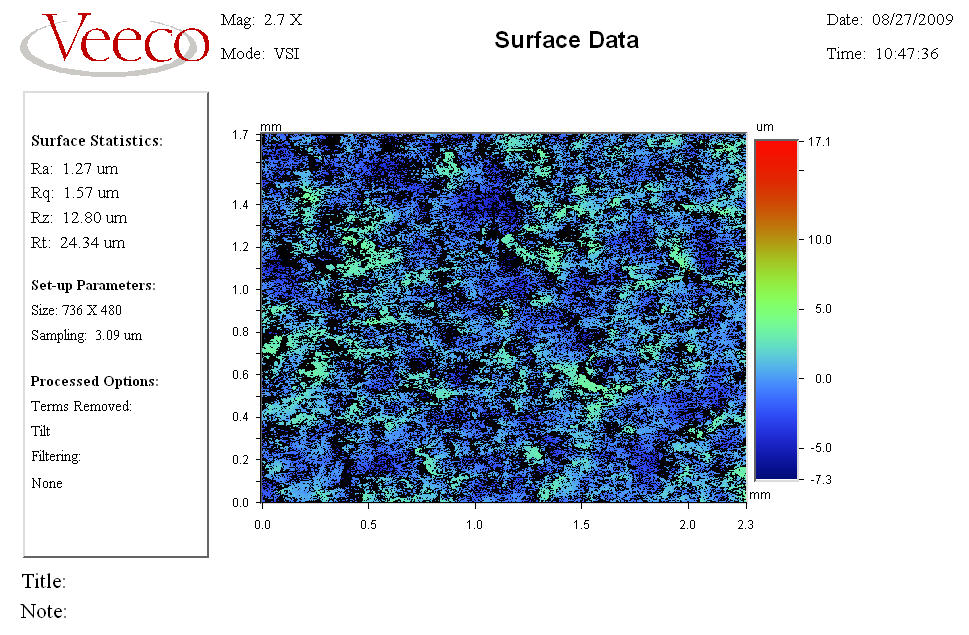
Unfortunately the white light profilometer software sucks at exporting to usable data sets like
CSV, etc. They would be annoying to parse anyways. The pictures show full profiles for the
glass slide and medium roughness slides. These are the only ones that came out OK on that
machine. The 'masked' views show the roughness of parts of glass in between their macro
scale roughness to give you an idea of what the glass is like in between the large 'hills
and valleys'. Also notice some of the roughness stats on the right.
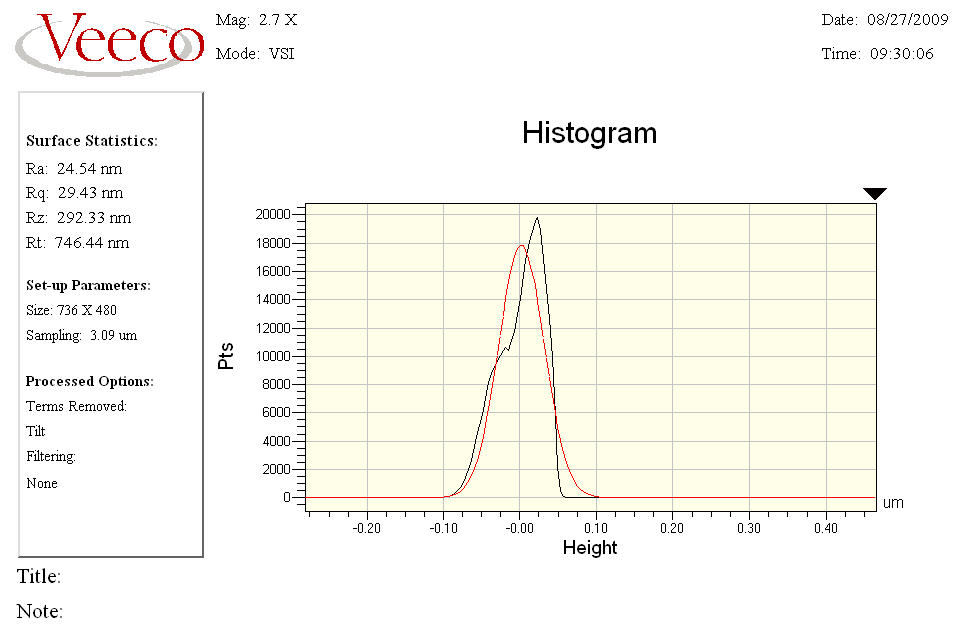
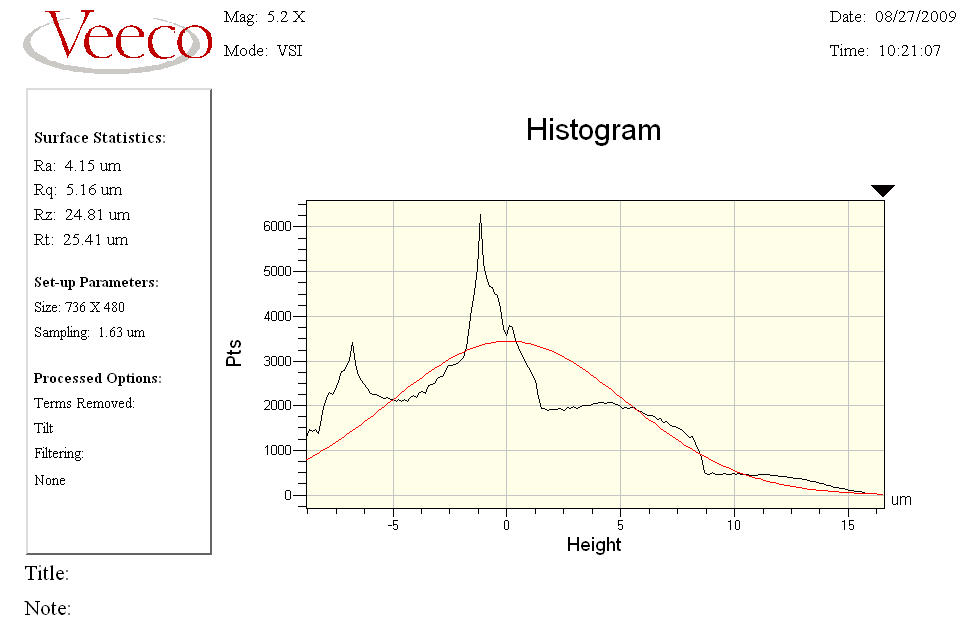
Histo's
These are histograms of the roughness data for the entire sampled area. again, these are only
available for the glass slide and medium roughness slide where we could get good readings
with the interferometer.
Data:
Glass Slide - Glass_Slide_2.7x.jpg:
- Glass_Slide_3D.jpg:
- Glass_Slide_Histo.jpg:
- fine_glass.pdf: fine_glass.pdf
- Fine_Glass_2.7x_mask1.jpg:
- Fine_Glass_2.7x_mask2.jpg:
- Fine_Glass_Zoom_Maskd.jpg:
- medium_glass.pdf: medium_glass.pdf
- Medium_Glass_5.2x_3D.jpg:
- Medium_Glass_5.2x_Histo.jpg:
- Medium_Glass_5.2x_maks2.jpg:
- Medium_Glass_5.2x_mask1.jpg:
- Medium_Glass_5.2x_mask3.jpg:
- Medium_Glass_5.2x.jpg:
- rough_glass.pdf: rough_glass.pdf
- Rough_Glass_2.7x_mask1.jpg:
Other Samples (Draper Steel, Painted Aluminum, Varnished Wood, Tar Paper)
Notes: This is the data for the Steel, Wood, and roof tile.CSV's (units Microns)
The laser confocal microscope will output roughness stats in this format for selected areas
of the scan. The stats are located in the bottom row of the excel file with labels above.
The 'large area' data comprised a large section of the piece (about a few mm
square) and the 'small area' data is from smaller areas where I tried to capture the roughness
data in between the larger hills and valleys. For the roof tile, the 'scope got noisy data
in between the huge rocks, so we could only take roughness data on the surface of individual
rocks, not of the large area. That might be a tricky measurement to make altogether. Each row
represents the roughness of a different rock stuck in the roof tile tar.
images
Albeit very dark, the images give you an idea of the areas we were scanning to take this data.
The roof tile one is almost unusable, but I figured I'd include it anyways.
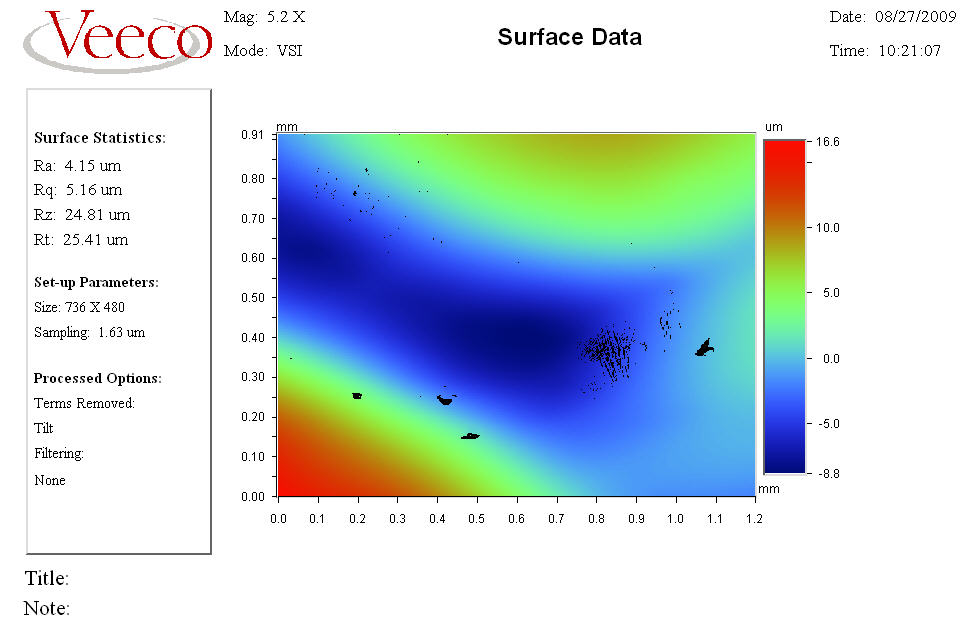
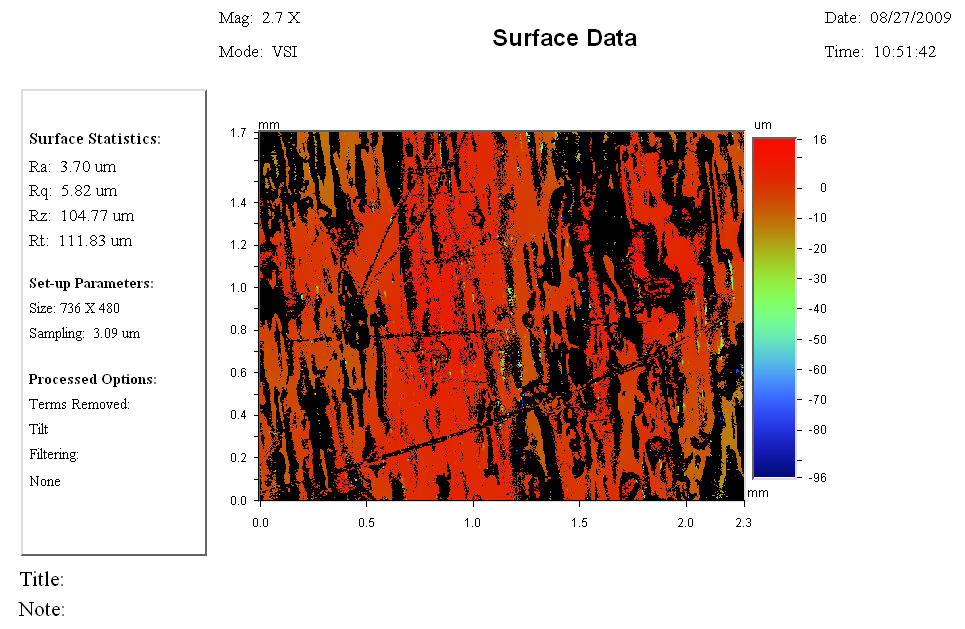
The veeco images are what the white light interferometer produced for the steel and wood.
Large slopes in the macro scale roughness can't be measured by this device and hence come up
black on the colormap plot. I thought it might be interesting to look at nonetheless.
Data:
Draper Steel
- Steel.jpg:
- steel.tif: steel.tif
- Steel_roughness_large_area.csv: Steel_roughness_large_area.csv
- Steel_roughness_small_area.csv: Steel_roughness_small_area.csv
- painted_steel.tif: painted_steel.tif
- Painted_Steel_surface_larger_area.csv: Painted_Steel_surface_larger_area.csv
- Painted_Steel_surface_smaller_hump.csv: Painted_Steel_surface_smaller_hump.csv
- Wood.jpg:
- wood.tif: wood.tif
- Wood_large_area.csv: Wood_large_area.csv
- wood_small_area.csv: wood_small_area.csv
- roof_tile.tif: roof_tile.tif
- roof_tile_multiple_small_areas.csv: roof_tile_multiple_small_areas.csv
Ideas, requests, problems regarding TWiki? Send feedback