new web: http://bdml.stanford.edu/pmwiki
TWiki > Rise Web>ClimbingRobot > ForceSensingAnkle>PreliminaryTests (30 Aug 2005, YongLaePark)
Preliminary Tests for Multi Axial FSA Construction
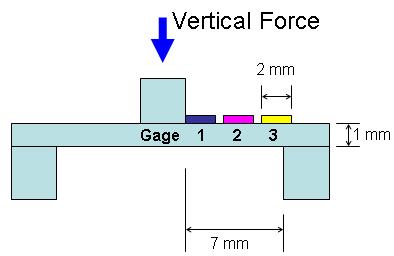
Several preliminary tests were conducted to charaterize the deformation of the diaphragm. The main objectives of the tests are to identify the best places to put strain gages which maximize output signal and minimize undesired force detection (distinguishement between lateral forces and vertical forces).Test 1: Vertical Force Test on a Load Cell with Foil Strain Gages
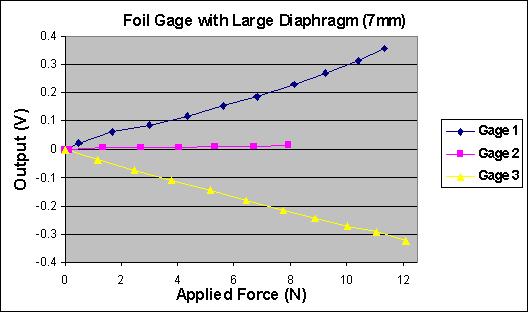
Three foil strain gages are placed at three different spots on the diaphragm, and vertical forces are applied to the load cell as shown in Figure 1-1. Figure 1-2 shows the plot of output signals.- Figure 1-1: Test Setup
- Figure 1-2: Voltage Output(mV) vs. Applied Force(N)
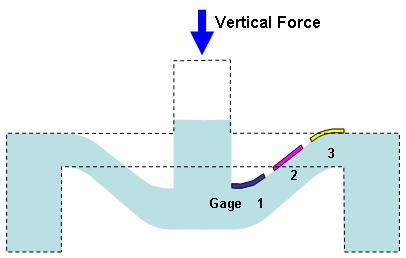
- Figure 1-3: Resulting Shape
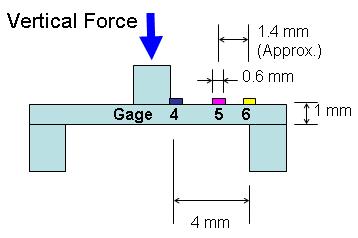
Test 2: Vertical Force Test on a Load Cell with Semiconductor Strain Gages
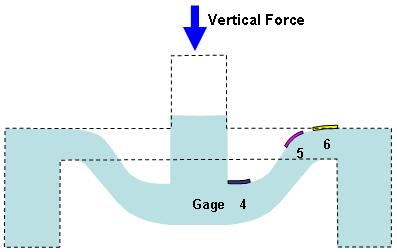
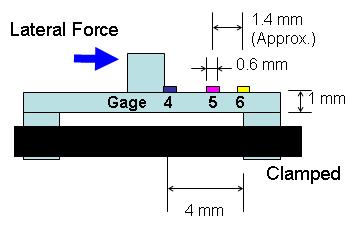
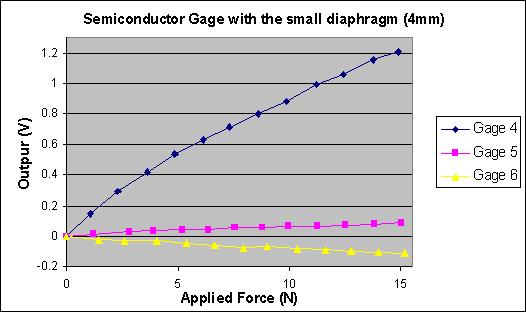
Three semiconductor strain gages are placed at three different spots on the diaphragm, and vertical forces are applied to the load cell as shown in Figure 2-1.- Figure 2-1: Test Setup
- Figure 2-2: Voltage Output(mV) vs. Applied Force(N)
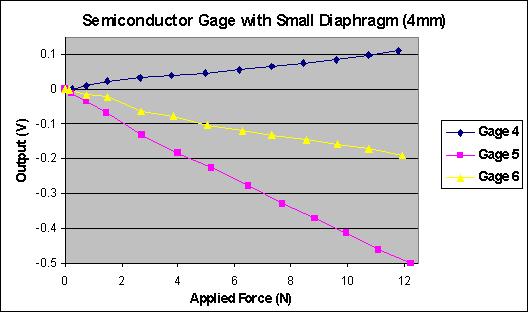
- The foil gages are large enough to cover the most bending area, but the semiconductor gages are too small to reach the bending area from the edge.
- Since the pink gage (gage 5) is placed off the center (approx. 3/4 point) and gives good signal, this gage covers the most bending area.
- Figure 2-3: Resulting Shape
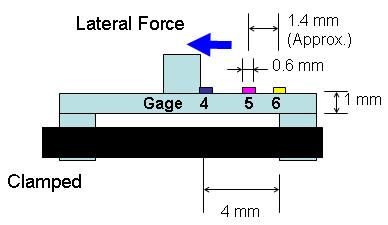
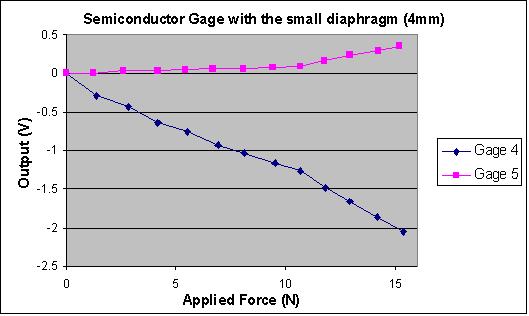
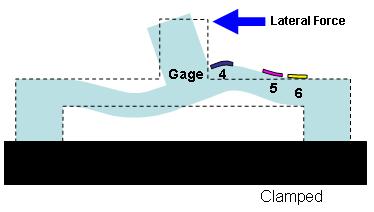
Test 3: Lateral Force(leftward) Test on a Load Cell with Semiconductor Strain Gages
Instead of vertical forces, lateral forces (from the gage) are applied to the semiconductor gage load cell as shown in Figure 3-1.- Figure 3-1: Test Setup
- Figure 3-2: Voltage Output(mV) vs. Applied Force(N)
- Figure 3-3: Resulting Shape
Test 4: Lateral Force(rightward) Test on a Load Cell with Semiconductor Strain Gages
The other lateral forces (to the gage) are applied to the semiconductor gage load cell as shown in Figure 4-1.- Figure 4-1: Test Setup
- Figure 4-2: Voltage Output(mV) vs. Applied Force(N)
- Figure 4-3: Resulting Shape

Ideas, requests, problems regarding TWiki? Send feedback