Horizontal Takeoff
Questions (24 Mar 2010)
- Why fix wing, how about VTOL, Hybrid VTOL, Hybrid Flapper?
- Why take off from horizontal Surfaces?
- Need a jumping mechanism to launch airplane. What is the mass beyond which jumping is not practical?
- What is the desired jump trajectory?
- What is the desired jump velocity? 90 degree Up? 45 degree? 75 degree?
- What kind of jump mechanism? click mechanisms?
- Does the jump need to be aided? ie hybrid flapper? props?
- Does the plane need to morph during launch stage?
- What is the orientation of the wings during the jump? folded? how is it folded? how is it deployed?
- Can landing be used as a way to recover lost kinetic energy by "charging" the jump mechanism?
- What is my goal? maximize takeoff velocity in what direction?
Performance Benchmarking (6 April 2010)
- Total system mass, M_t
- for a desired M_t what is the take off velocity, v_t? got to differentiate between v_t_com and v_t_localWing
- How to achieve v_t? to achieve high v_t, some sort of mechanism that slowly charges an elastic element and releases the energy in a short amount of time amplifies power. Also long jumping hind limbs allows more time for the Center Of Mass (COM) to accelerate to higher velocities. The drawback of having longer limbs is added mass.
- what happens to the jumping mechanism after takeoff? multipurpose usage of jumping mechanism for take off and flight control?
- After finding v_t, find the kinetic energy at take-off, KE_t=1/2*m*(v_t)^2
- To account for eventual energy losses and taking into account components that can be bought off the shelf (springs etc) design system to produce 2*KE_t (is 2 too much or too little?)
- assumptions : constant acceleration(watch this because this is not the case usually. usually its a curve)
- need to size the acceleration distance, s. s is proportional to jumping leg length. ie the length of the leg just prior to take-off
W=Fxs
W = 2*KE_t
F = W/s
F=ma
a = F/m
for u=0
s = 1/2*a*t^2
t = (s*2/a)^0.5
P = W/t
preliminary estimates (6 April 2010)
M_t = 0.4kg
v_t = 5 m/s ( based on measurements from current planes in the lab)
W = 2*KE_t = m_t*(v_t)^2 = 0.4 kg * (5 m/s)^2 = 10 J
s = 0.1m (does not look realistic)
F = W/s = 100N
a=F/m_t = 100N/0.4Kg = 250 m/s^2
t = 0.707s
P = 14.1 W
Paper Review (6 April 2010)
KINEMATICS AND MECHANICS OF GROUND TAKE-OFF IN THE STARLING STURNIS VULGARIS AND THE QUAIL COTURNIX COTURNIX by Earls, Kathleen D
Summary:
S. vulgaris and C. coturnix both produce 80%u201390% of the velocity of take-off with the hindlimbs. S. vulgaris performs a countermovement jump (peak vertical force four times body weight) followed by wing movement, while C. coturnix performs a squat jump (peak vertical force 7.8 times body weight) with simultaneous wing movement. The wings,while necessary for continuing the movement initiated by the hindlimbs and thereafter supporting the body weight, are not the primary take-off accelerator.
ME391 project goals (7 April 2010)
A Jumping Flyer
Goal: determine if Jumping is a feasible way to launch Small Unmanned Air Vehicles (SUAV)
Motivation: SUAVs do not have to autonomous ability to relaunch itself once it has landed; it requires a human operator to physically relaunch the system.
Catapult Launch systems are used extensively as launch platforms for UAVs. However, the existing systems are bulky and are useful as long as the UAV returns to the launch site. This inherently limits the range a UAV can operate.
In nature, birds and insects are observed to employ jump mechanisms to launch themselves into the air. Can such mechanisms be employed on SUAVs? If such a mechanism can be designed, SUAVs could potentially extend their mission by landing and recharging their energy source by perhaps solar energy and then relaunch itself to continue its mission.
A few questions come to mind:
What is the range of mass would jumping be physically possible?
Where should the Center Of Mass (COM) be located?
Where does the reaction force from the ground on the SUAV pass through? If the force passes through any other point other than COM, torques will be generated. If torques are generated, is a pitch up or pitch down torque more desirable?
Folded/Stowed then deployed after take-off to reduce the influence of drag during the jump?
or fixed in a certain way so that it aids rather than hinder the jump
- What is the trajectory the COM must travel before take-off?
The longer the trajectory the COM travels with the "feet" of the plane still on the ground, the bigger the take off velocity. A longer trajectory corresponds to longer "jumping limbs" This is observed in nature where frogs have limb lengths nearly twice their body lengths.
Paper Review (17 April 2010)
The mechanical power output of the flight muscles of blue-breasted quail (Coturnix chinensis) during take-off by Graham N. Askew,*, Richard L. Marsh and Charles P. Ellington
"Unfortunately, we do not have sufficient data to enable us to eliminate the possible contribution from a hindlimb-powered jump in the four species from Tobalske and Dial%u2019s study (Tobalske and Dial, 2000). However, the mechanical power output of take-off power in jumping anurans is independent of mass (Marsh, 1994) and, if the same is true in the Phasianidae, the power provided by the hindlimbs during an initial jump will not affect the scaling of the power required from the pectoralis muscles."
How does mass affect the take off mechanism of birds?
- Small birds exhibit near vertical take off capability.
- Large birds like the albatross requires them to flap and run to aid them in take off
Conclusion: Mass does affect the mode of take off. Beyond a certain mass, birds do not jump to assist them in take off but employ alternate means to achieve flight.
What is this mass? How does this relate the jumping in fix wing UAVs?
Paper Review (18 April 2010)
Leg Thrust Important In Flight Take-Off In The Pigeon by Frank H. Heppner and John G. T. Anderson
Measurements of the force generated by the legs of rock doves Columba livia during vertical and near-vertical take-off showed that the birds were able to develop an upward directed force of from 1.3 to 2.3 times their body weight. This force resulted in an instantaneous acceleration of 15.63 ms^(-2) at maximum thrust. Motion pictures taken during the take-off showed that as the birds' feet left the experimental perch, their wings were in the overhead clap position. We suggest that the vertical take-off in birds is accomplished in three stages; leg thrust, clap-and-fling and steady-state flight.
Meeting (April 22nd 2010)
Plan of attack:
- build simulator, have test cases to validate simulator. Model 2 gliders. One at 400g and one at 15g. look at vt> and wt>, assume body angle of max 20 deg
- add elevator and thrust control
- build launcher
- Build jumping mechanism
End Of Spring Quarter Report (June 11th 2010)
- End Of Spring Quarter Report
Spring2010endOfQuarterReport.pdf
Summer 2010 Report
Carbon Beam Spring Modelling
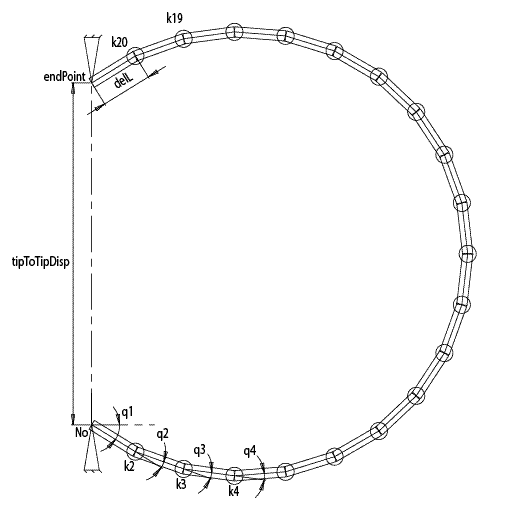
Figure 1. Schematic of how beam is modeled as a series of rigid massless linkages with torsional springs in between each link.
The carbon beam is modeled as a series of 20 rigid links. Each link is of length delL, width b and height h. In between each link is a torsion link with torsional stiffness k. k1 = 0 because of the pin joint while k2 to k20 are set to be initially symmetric. For example, k2 = k20, k3=k19, k4 = k18 (symmetry chosen as a first guess, further analysis may indicate a non symmetrical distribution of stiffness). The torsional stiffness is given by:
k= EI/delL
where I= (bh^3)/12 and E is the flexural modulus of the material. Since the carbon beam is modeled as pinned at both ends, it is a 2 force member. Therefore the reaction forces at the pin joints must be collinear, equal in magnitude and in opposite sense.
Finding q(i)s
Using Lagrange’s equations of the second kind and Knowing the array of torsion stiffness values along the beam, the Potential Energy (PE) of the system is calculated.

There are 2 geometric constraints in this formulation
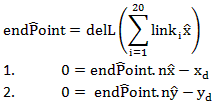
where link(i)x> is the unit vector along the neutral axis of each link and (xd,yd ) are the known coordinates of the endpoint from No. Therefore, to solve for 20 q(i) the PE is minimized subject to the above constraints. Since there 2 constraints, 2 Lagrange multipliers are introduced, λ1 and λ2 to augment the PE equation:

This results in 22 unknowns needing 22 equations to be solved. The first 20 equations are of the form

and the next 2 equations are from the 2 constraints. Therefore we can solve for q1,q2…q20 ,λ1 and λ2.
Finding the Fx and Fy at the endpoint knowing q1 to q20
Using the Principle of Virtual Work

The work that the force does in changing the position of the endpoint is the same as the virtual work it performs in rotating the links. Therefore,
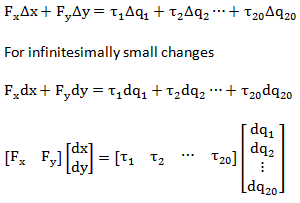
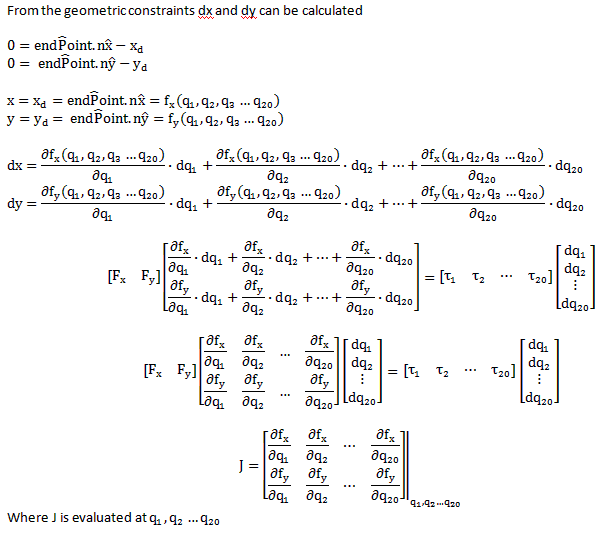
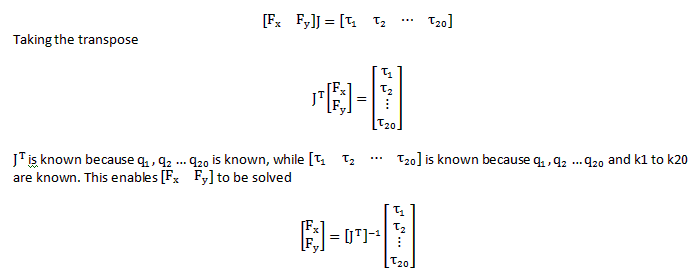 Finding the force tipToTipDisp profile
A set of n known endpoints are chosen. In the Matlab code findForceDisplacementProfileOfCarbonBeamSpring.m, x_d=0 and y_d is a set of n points between the minimum tipTotipDisp and the maximum tipTotipDisp (unstressed carbon beam length). Looking at the graph generated by the Matlab code, a cubic equation is fit through the set of n points to give F=f(tipToTipDisp) which is hard coded into into the simulation of the jumping plane in jumpingPlane23.m where F is the variable called springForce.
Estimating flexural stress along the beam
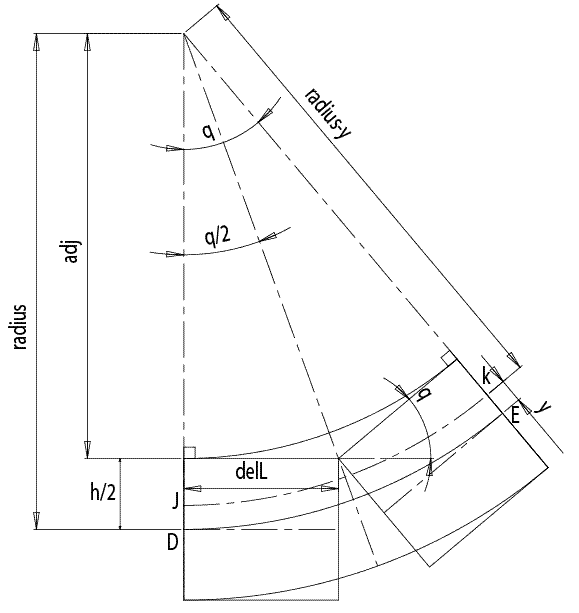
Figure 2. A 2 element chain is used to approximate a beam in bending.
(Derivation taken from Mechanics of Materials 4th ed, Beer, Johnson,
DeWolf? )
The radius is defined as the arc DE. As such the length L of the arc DE is

Consider the arc JK, y distance above the neutral axis

JK was deformed by

Substituting L and L’ into δ

The strain


The flexural stress


where E is the flex modulus. Substituting

into


Since we are interested in comparing the maximum flexural stress σm to the flexural strength σf

Where (h/2) is the maximum distance of the beam’s surface from the neutral axis and radius is given by
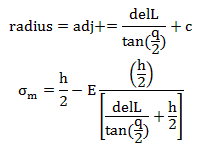
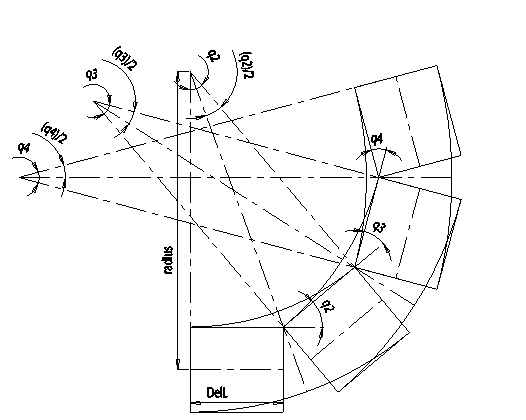
Figure 3. This figure shows how each link is used to estimate the flexural stress on the surface of each link.
To estimate stress along the 20 link beam, flexural stress is evaluated at each link. For link1, since it is pinned at one end, there is no stress in the link. Subsequently, link(i)’s flexural stress is due to a bend of q(i). Flexural stress along the beam is:
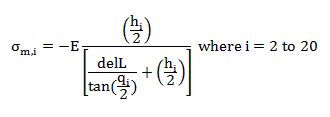
Flexural stress is also evaluated in findForceDisplacementProfileOfCarbonBeamSpring.m
Designing the spring
Target: Maximize
StoredPotentialEnergy? /MassOfSpring by varying b and h
Subject to:
- σ(i)<σf
- StoredPotentialEnergy? >MinimumRequiredPotentialEnergy
- Finitial<Fmax (tricky one. think more)
Things to do:
- what kind of force profile is beneficial for jumping?
- what shape of the spring?
- how does the shape change with a sinusoidal varying stiffness(stiffer in the center less stiff at tips), linear varying stiffness (thicker at foot thinner at Ahinge vice versa)?
- Would want the stress profile along the beam to be everywhere close to the maximum flexural strength
- What is the MinimumRequiredPotentialEnergy? to launch a 0.4kg UAV? What does it mean to have a successful jump?
Simulation of jumping plane
Matlab code jumpingPlane23.m was generated using
MotionGenisis? from jumpingPlane23.al.
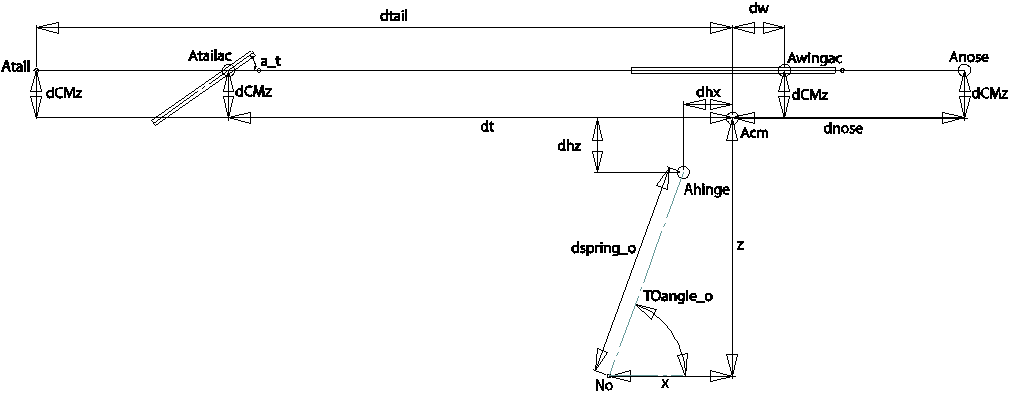
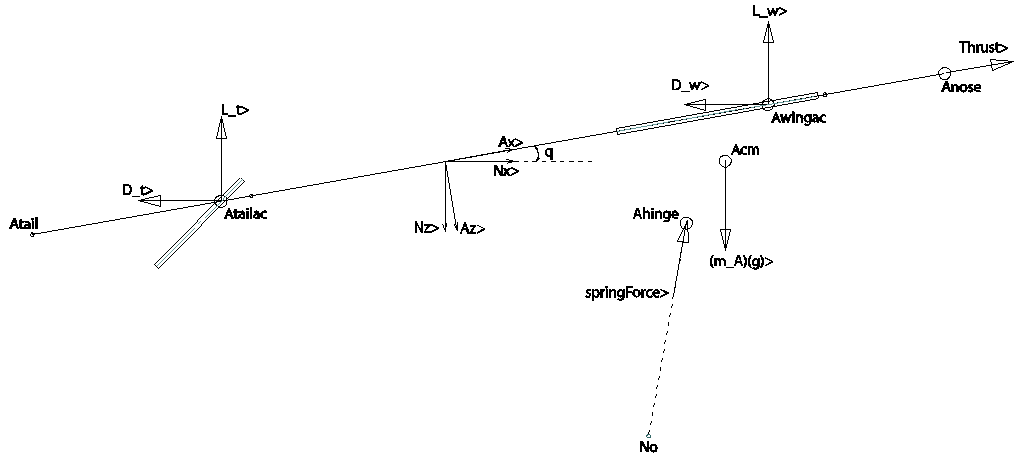
Figure 5. Simplified 2D model of aircraft. 2 reference frames, Newtonian N and Aircraft A.
Assumptions
- Aircraft is stable in roll
- Air foil of wing and elevator are flat plates
- Mass of carbon spring is negligible
- Thrust from propeller is derived from actuator disk theory. The effect of the prop wash is negligible over the wing but significant over the tail. This means the velocity at the tail aerodynamic center and the angle of attack of the tail is augmented by the propwash
- No slippage during the jump
- Contact of carbon spring and ground modeled as a pin joint
| Quantity |
Identifier |
Type |
(Initial) Value(s) |
| Ax> measure of Anose from Acm |
dnose |
constant |
0.2216 m |
| Ax> measure of Atail from Acm |
dtail |
constant |
-0.5514 m |
| Ax> measure of Atailac from Acm |
dt |
constant |
-0.3915 m |
| Ax> measure of Awingac from Acm |
dw |
constant |
0.0718 m |
| ax> measure of Ahinge from Acm |
dhx |
constant |
-0.0125 m |
| az> measure of Ahinge from Acm |
dhz |
constant |
0.03385 m |
| az> measure of Anose, Atail, Awingac and Atailac from Acm |
dCMz |
constant |
-0.0515 m |
| Area of wing |
s_w |
constant |
0.14 m^2 |
| Area of tail |
s_t |
constant |
0.017 m2 |
| Density of air |
rho |
constant |
1.2041 kg/m^3 |
| Local gravitational constant |
g |
constant |
9.81 m/s^2 |
| Mass of aircraft |
m_A |
constant |
0.55 kg |
| Inertia of aircraft about Acm |
I_yy constant |
0.0164 kgm^2 |
| Initial spring distance from Ahinge to No |
|
dspringDis_o |
0.1m |
| Initial angle of spring force with nx> |
|
TOangle_o |
40º |
| ax> measure of thrust applied at Anose |
Thrust |
specified |
|
| Static thrust |
To |
constant |
4.9N |
| Gradient of thrust incoming nose velocity curve |
T1 |
constant |
-To/15 |
| magnitude of carbon beam spring force on Ahinge acting from No |
springForce |
specified |
|
| angle of tail chord line with ax> |
a_t |
specified |
|
| Local wing alpha (angle between the local wing velocity and ax>) |
q_w |
specified |
|
| Local tail alpha (angle between the local tail velocity and ax>) |
q_t |
specified |
|
| nx> measure of Acm from No |
x |
variable |
dspring_o*cos(TOangle_o) +(-dhx) |
| nz> measure of Acm from No |
z |
variable |
-(dspring_o*sin(TOangle_o)+dhz) |
| ny> measure of the angle between ax> and nx> |
q |
variable |
0 rad |
Table 2. List of identifiers used in simulation
Choosing take-off angle
MatLab Code used: findLaunchAngle.m
Take-off speed was set at 10 m/s. Take-off angle was increased from 0 ° to 90 °. This was implemented by setting the initial velocity of the Acm which simulates a jump with a springForce passing through Acm. This implies that the initial rate of change of q, qp, is 0.
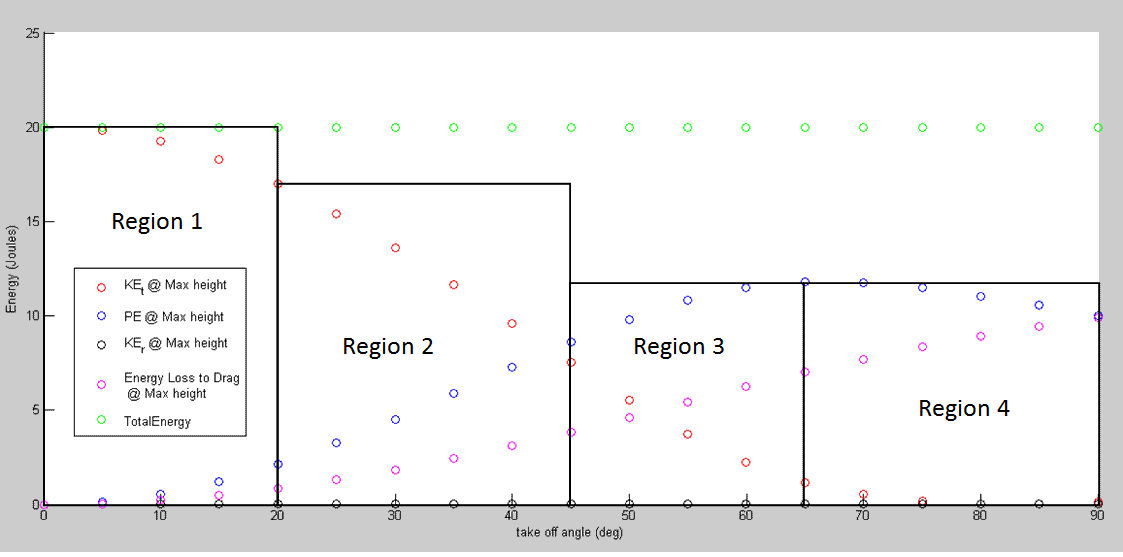
Figure 6. This graph shows the KE, PE and energy loss to drag at the maximum height of a trajectory at different take off angles. Tail trim at 0 °
Trends from figure 6:
- Energy loss to drag increases as take off angle increases.
- PE plateaus from 60 ° to 75 °
- KE_t decreases approximately linearly from 25 ° to 60 °. KE_t loss at 25 ° is 23%. KE_t loss at 60 ° is 89%
During this simulation, there was no throttle input. A jump was simulated by setting the take off speed and take off angle of the aircraft’s center of mass. As seen in figure 6, the range of take-off angles in region 1 maximizes the KE of the aircraft but the PE gained is negligible. Therefore, aircraft launched in this region would not be able to take off in environments where there are obstacles in its take off path. At the other extreme, aircraft launched in region 4 are disadvantaged because of the significant loss of KE. Also, the plateau of the PE curve at take off angles greater than 50° indicates that there is no benefit in terms of gain in PE. Perhaps the benefit of launching in region 4 is the ability to clear obstacles that is in close proximity to the aircraft.
The most efficient jumps occur at angles 0° to 20°. If efficiency is not a top priority, jumping at 50° or 90° makes no difference because of the plateau in the energy loss to drag in this range.
In region 1 and 2, slippage becomes a concern at the contact of the ground and the jumping aircraft at such low angles of take off.
At 40° take off, 52% of the KE is lost, while PE gained is 36%. At 50°, 72% of KE is lost while PE gained is 49%.
Things to do: at 40° jump angle, with the same take off speed sweep through the tail trim to see if the loss in KE can be decreased
As a compromise between minimizing KE losses and maximizing gain in PE, 40° was chosen as the candidate take off angle for powered propeller jumps.
Video Analysis of Constant width constant height Carbon Beam Spring on Aircraft without Propeller

Figure 7.Spring used was 4, 12x1x(1/32) inch non unidirectional carbon fiber strip.
A ledge on the aircraft was angled at 40° to set the initial take off angle at 40°. However, after video analysis, the initial take off angle was found to be close to 60°
Comparison of experiment with simulation
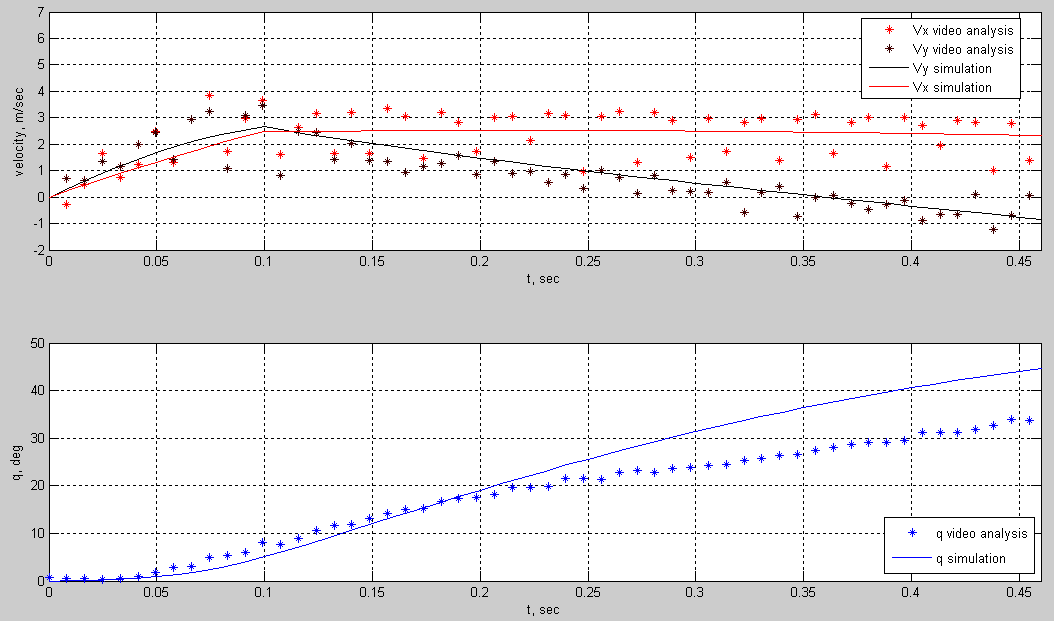
Figure 8. experiment and simulation show good agreement. q grows over time which could be due to an initial qp.
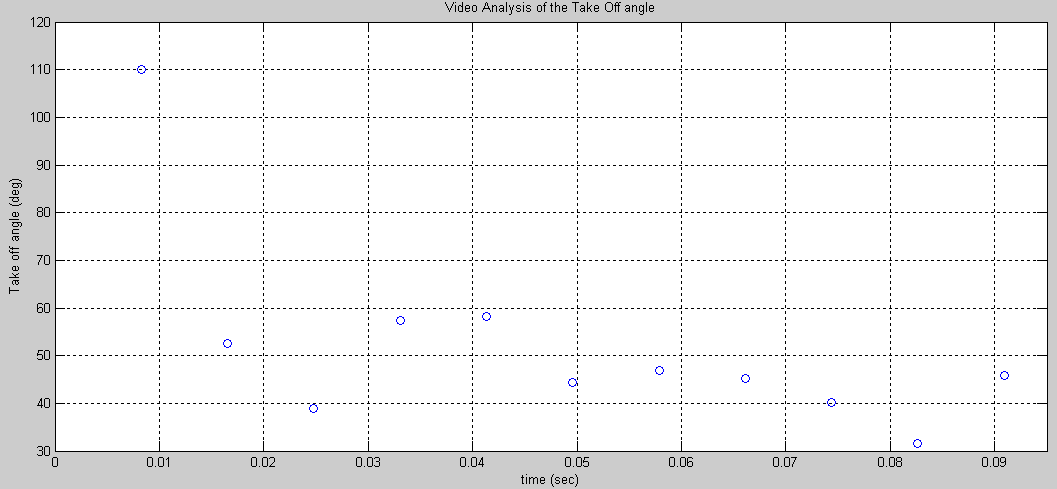
Figure 9. Variation of the take off angle during the duration of the jump. The take-off angle was close to 60° at the start of the jump but decreased to 45° at the moment of lift off when the feet of the jumper leaves the ground.
To check the simulator, a 4 strip carbon fiber beam spring made out of carbon weave 77 was attached to an aircraft. A ledge angled at 40° was attached to the base of the aircraft to set a take off angle of 40°. However, after video analysis, the initial take off angle was found to be 60°, at the instant of lift off, the velocity of the CM was 45° with respect to the Nx> unit vector of the Newtonian frame. The aircraft and carbon spring had a mass of 0.55kg. The force displacement equation representing the 4 strip carbon fiber beam spring is(from findForceDisplacementProfileOfCarbonBeamSpring.m):

f(x) was hard coded into the simulation code jumpingPlane23.m
The simulation and experiment show good agreement during the jump and deviate slightly after the jump. The simulation predicts a higher jump height and further jump distance than the experiment. This could be due to more drag caused by the panels on the experimental aircraft’s sides where in the simulation no such panels exist.
Just before the spring was released during the experiment, the CM of the aircraft was 6 cm behind the manufacturer recommended CM location. When the manufacturer recommended CM location was used in the simulator, the aircraft was predicted to have pitch angle q decrease below zero. Clearly the experiment does not match the simulator in this case because the pitch angle in experiment is seen to increase and not decrease below 0. When the CM was shifted back 6cm in the simulator, the aircraft was predicted to have increasing q. However, the q increased too much. On measuring the z location of Acm, we realized that Acm was not lying on the same axis as Awingac and Atailac. After including dCmz along the Az> axis as an offset, the simulation and experiment yielded much better results as seen in figure 8.
Having chosen 40° as take off, how does tail trim affect the translational KE at the top of the aircraft's trajectory?
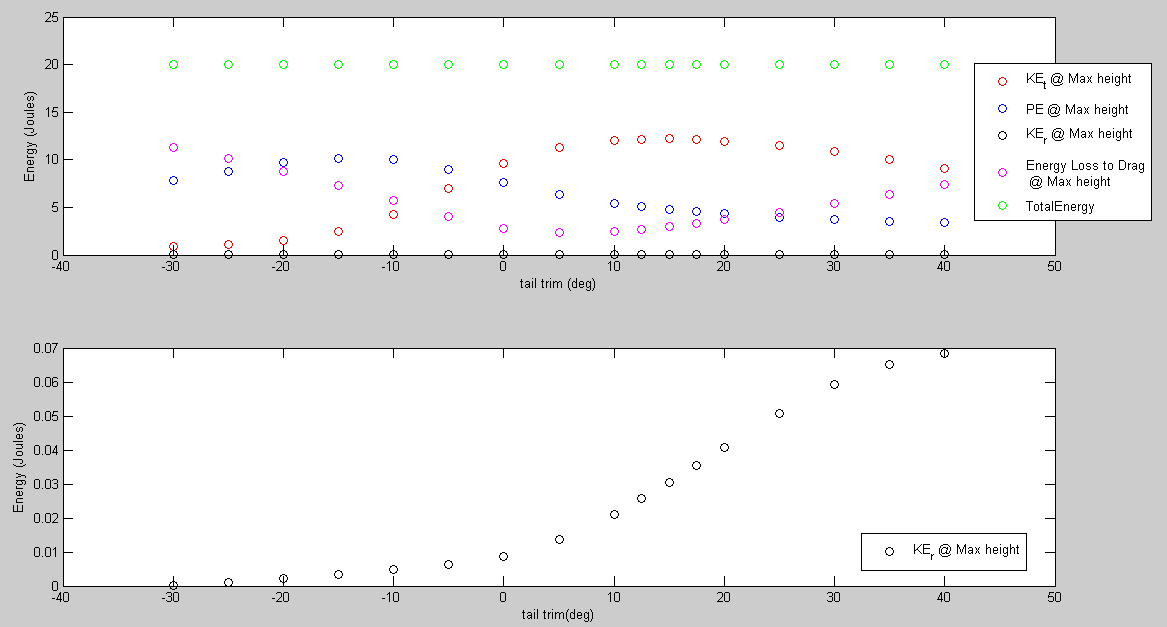
Figure 10. Tail trim does affect the energy state of the aircraft. At a tail trim of 15°, 39% of the tranlational KE is lost while at a tail trim of 0°, 52% of the translational KE is lost. This comes at the cost of a greater loss in height.
There are 2 interesting regions in figure 10. The first is in the vicinity of -20° to -10°. Here, the PE gained is highest but at the cost of low translational KE. The second is in the vicinity of 0° to 20°. At 0°, the energy loss to drag is at 14%, the translational KE loss is 52% while the PE gain is 38%. At 5°, the energy loss to drag is the lowest at 12%, the translational KE loss is 44% while the PE gain is 32%.At 15°, the energy loss to drag is at 15%, the translational KE loss is 39% while the PE gain is 24%.
Comparing a tail trim of 0° to 15°, the energy loss to drag is similar. However, there is a significant reduction in translational KE losses to jump at a tail trim of 15° at the cost of a lower maximum jump height.
Based on the results in figure 9, a possible range of fixed tail trims is in the range of 0° to 15°.
The next question is: instead of fixing the tail trim, is there a trajectory from beginning of jump to maximum jump height that minimizes the energy loss due to drag and minimize the loss in translational KE?
Simulation of a powered propeller with carbon spring designed with a sinusoidal width and from GC-70-UCL
Things to do:
- can we climb?
- turn on p control later in jump
- Simulate at manufacturer recommended Cm location. Would want to design CM location to lie along the thrust line to minimize unnecessary pitching moment
--
ZhiErnTeoh - 16 Sep 2010
--
ZhiErnTeoh - 18 Sep 2010
Designing the spring
- Figure out what is the desired KE and PE at the top of its trajectory. ie when it has zero upward velocity. (use simulation to find straight and level flying conditions)
--
ZhiErnTeoh - 20 Oct 2010
- Prototyped cable tie release mechanism.
- Loading actuators
- SMA with compact box, pulleys loops
- modified servo again compact small box to house structure, with pulleys for mechanical advantage, will need one way clutch
--
ZhiErnTeoh - 30 Oct 2010
- For flexinol, the bend radius is 20 x the diameter of the wire
 RisePrivate Web>PrivateRiSE > PerchingBird>HorizontalTakeoff (30 Oct 2010, ZhiErnTeoh)