new web: http://bdml.stanford.edu/pmwiki
TWiki > Rise Web>TWikiUsers > SamsonPhan>QtcSensors (11 Jun 2008, SamsonPhan)
Sensor itself consists of QTC switch substrate (medium) sensitivity
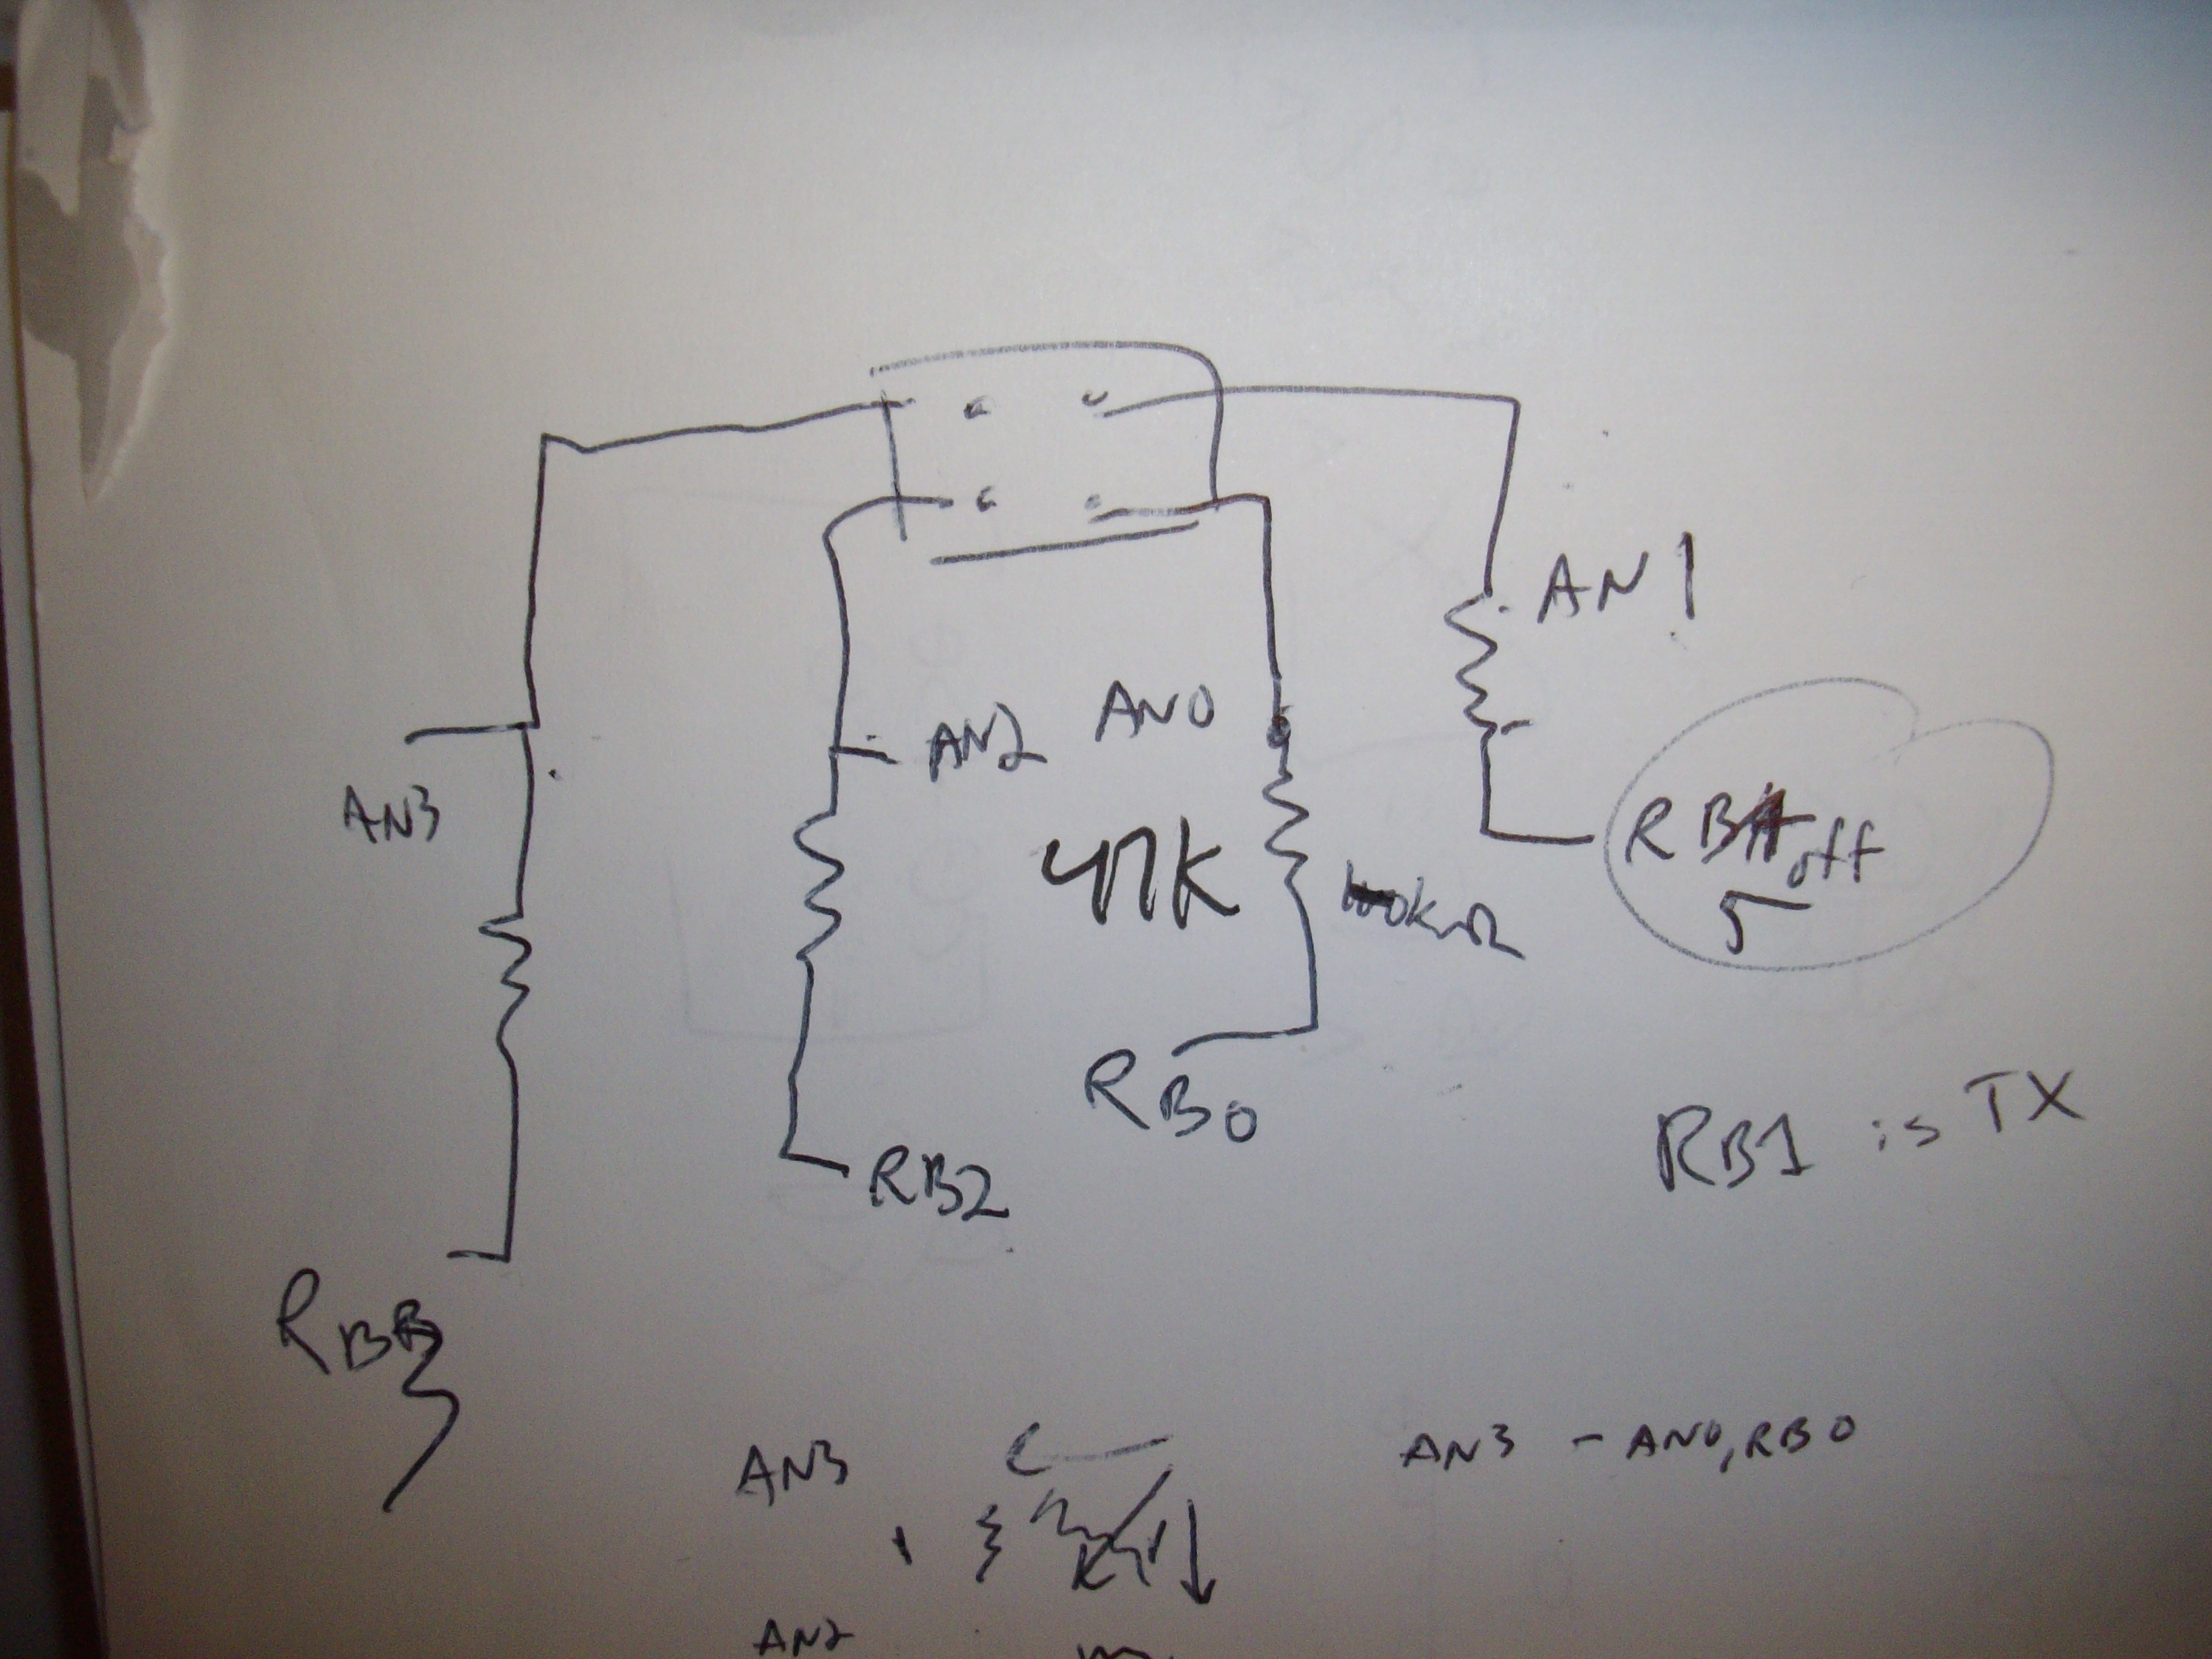
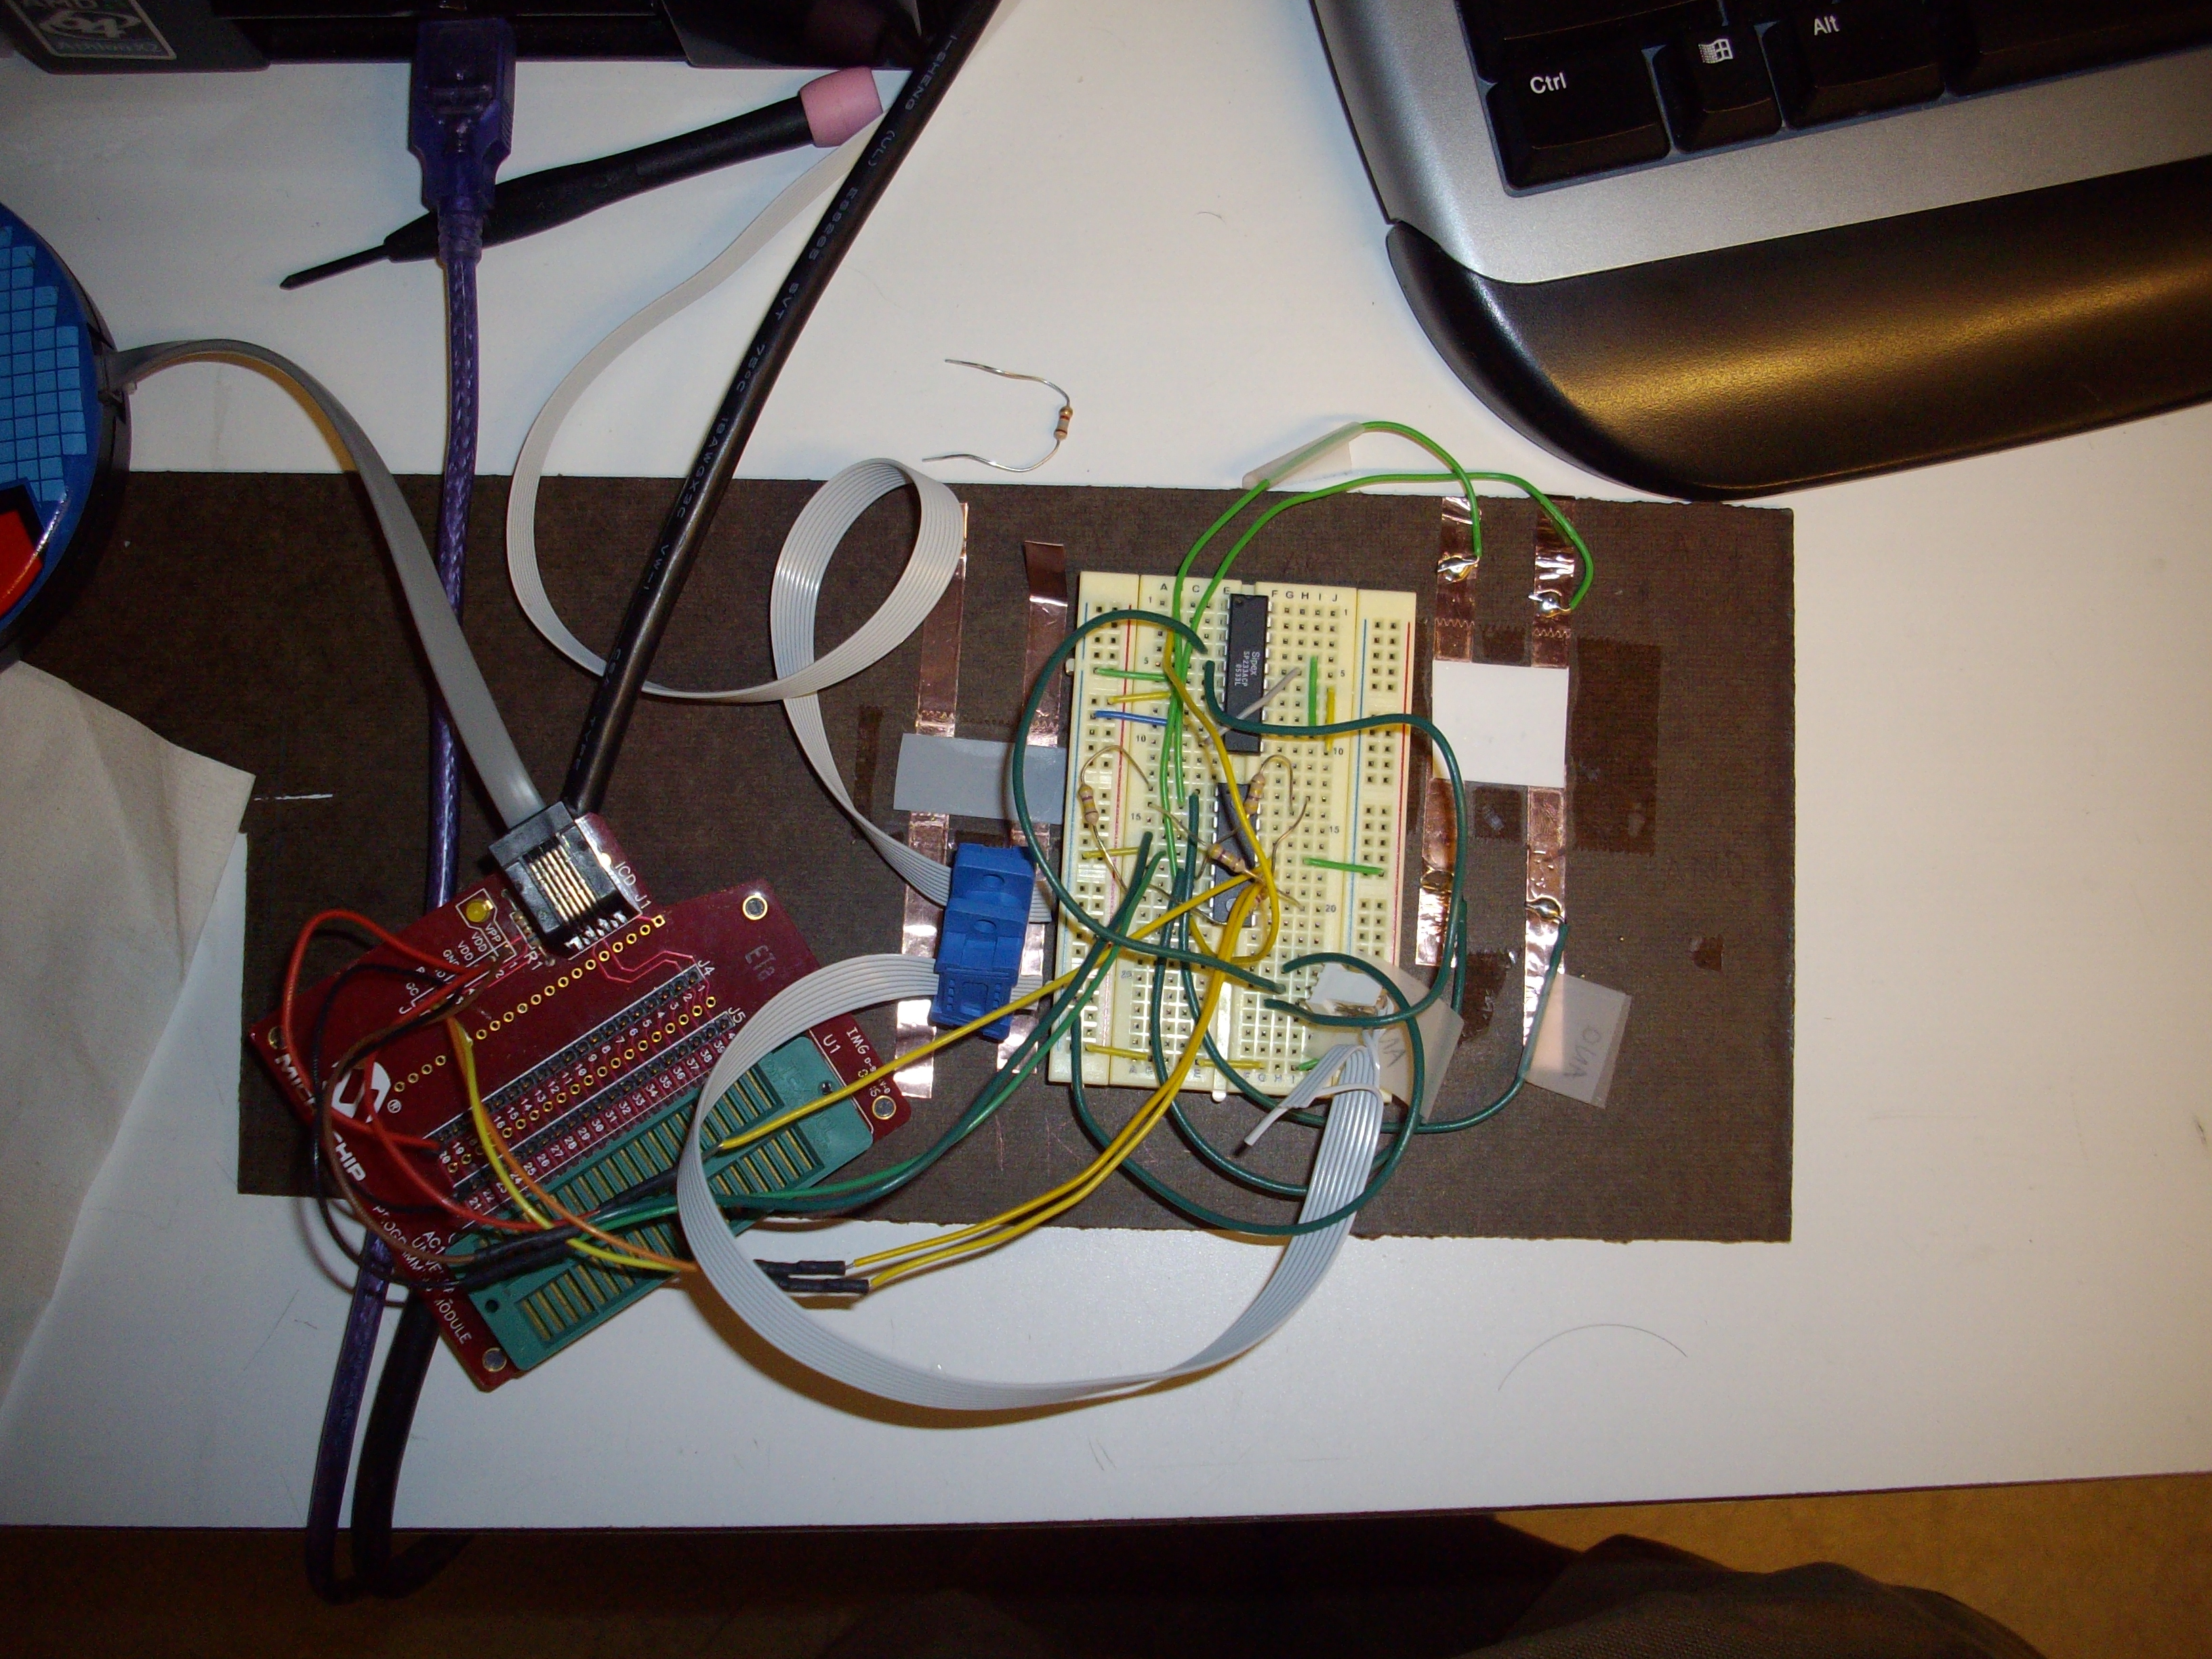
PIC + Sipex chip (for serial port connection)
 MatlabScript to get data out and display as bar graphs. The graph shows the comparison between 2 nodes
I taped some QTC switch substrate onto an array of 4 copper electrodes, spaced 1 cm apart in a square configuration. Communique from Peratch suggests no direct adhesion method to the electrodes.
MatlabScript to get data out and display as bar graphs. The graph shows the comparison between 2 nodes
I taped some QTC switch substrate onto an array of 4 copper electrodes, spaced 1 cm apart in a square configuration. Communique from Peratch suggests no direct adhesion method to the electrodes.
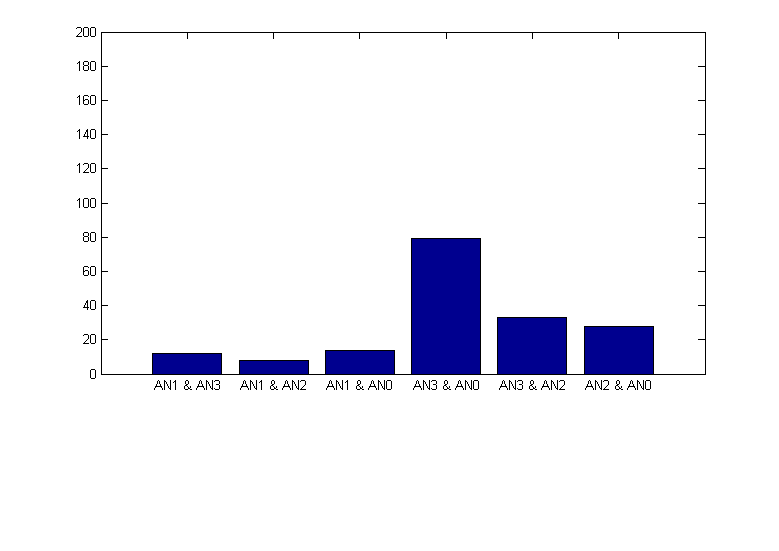 This data shows baseline(no pressure placed). We think this is because of the different contact resistance.
When pushing down, the most sensitive place is directly on top of the electrode. Pushing down on the area between the electrodes does little to change the readings. This suggests that the main modality of change in resistance is due to the contact resistance changes, no necessarily that of the material being compressed and changing resistance of the material.
This data shows baseline(no pressure placed). We think this is because of the different contact resistance.
When pushing down, the most sensitive place is directly on top of the electrode. Pushing down on the area between the electrodes does little to change the readings. This suggests that the main modality of change in resistance is due to the contact resistance changes, no necessarily that of the material being compressed and changing resistance of the material.
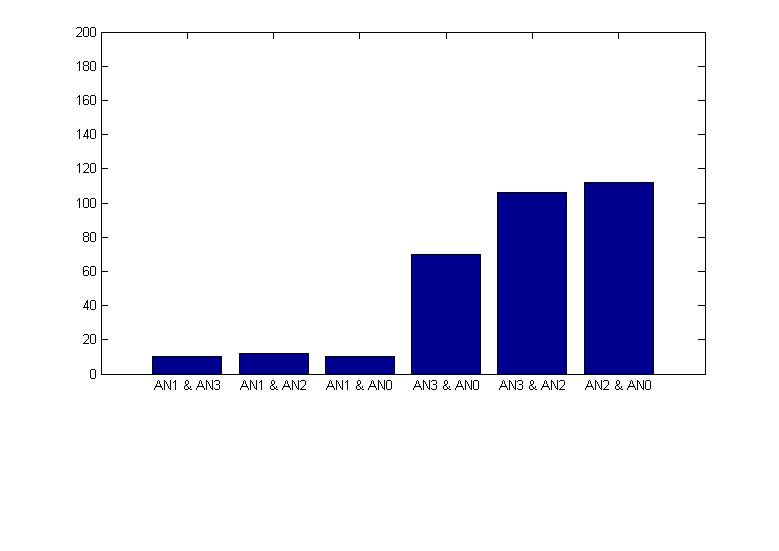 This case is when one pushes down on AN2. There is definitely some amount of cross talk. Future work will revolve around finding a way to secure the material to eliminate the possibility of contact resistance changes. I don'tknkow why some of the data points dip when i push down.
-- SamsonPhan - 10 Jun 2008
This case is when one pushes down on AN2. There is definitely some amount of cross talk. Future work will revolve around finding a way to secure the material to eliminate the possibility of contact resistance changes. I don'tknkow why some of the data points dip when i push down.
-- SamsonPhan - 10 Jun 2008
MatlabScript to get data out and display as bar graphs. The graph shows the comparison between 2 nodes
I taped some QTC switch substrate onto an array of 4 copper electrodes, spaced 1 cm apart in a square configuration. Communique from Peratch suggests no direct adhesion method to the electrodes.
This data shows baseline(no pressure placed). We think this is because of the different contact resistance.
When pushing down, the most sensitive place is directly on top of the electrode. Pushing down on the area between the electrodes does little to change the readings. This suggests that the main modality of change in resistance is due to the contact resistance changes, no necessarily that of the material being compressed and changing resistance of the material.
This case is when one pushes down on AN2. There is definitely some amount of cross talk. Future work will revolve around finding a way to secure the material to eliminate the possibility of contact resistance changes. I don'tknkow why some of the data points dip when i push down.
-- SamsonPhan - 10 Jun 2008 Ideas, requests, problems regarding TWiki? Send feedback